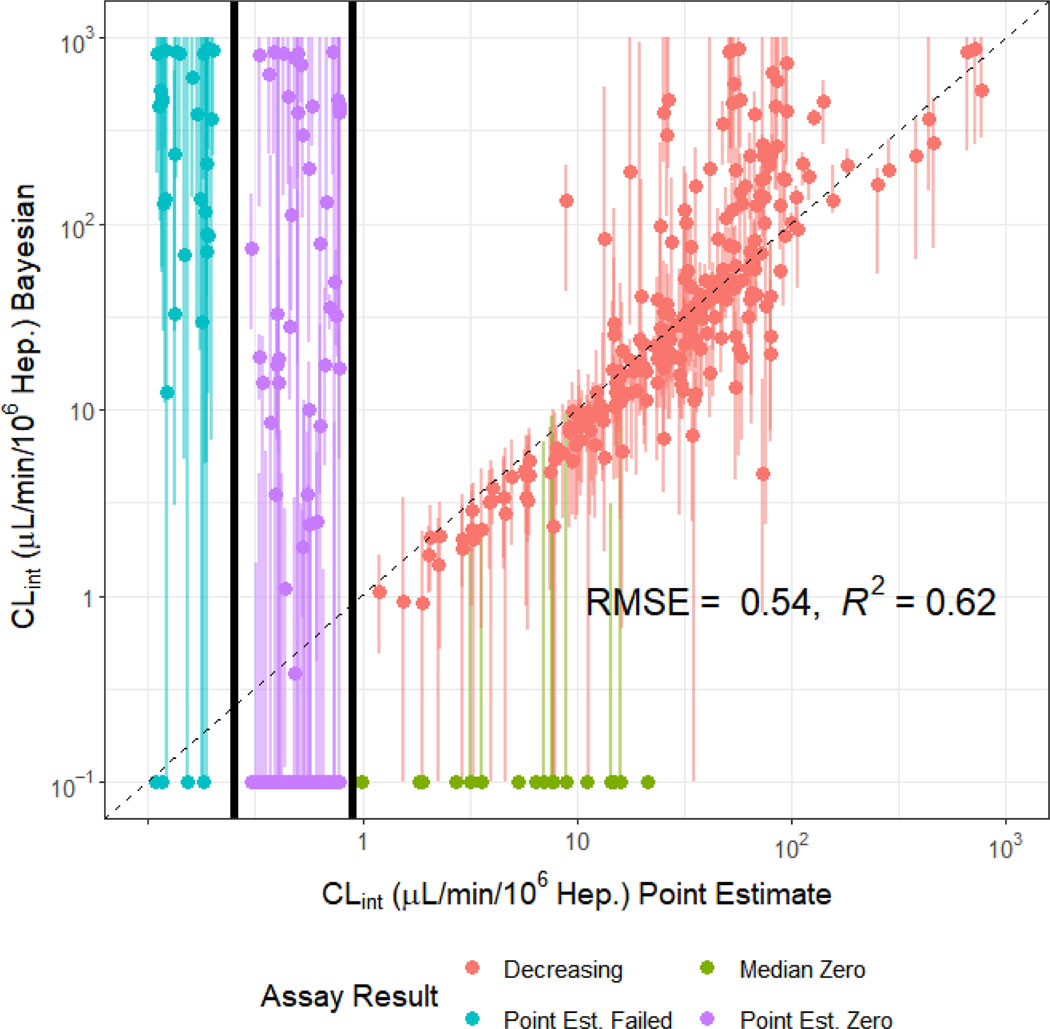
Figure 4.
Comparison of Bayesian Clint and Uncertainty Estimations to Experimental Point Estimates. Clint estimate for 1 μM chemical concentration displayed, though 1 and 10 μM were fit jointly. The size of the credible interval varies significantly from chemical to chemical, especially for the lower clearance rates. Plots of individual fits are provided as supplemental material.

