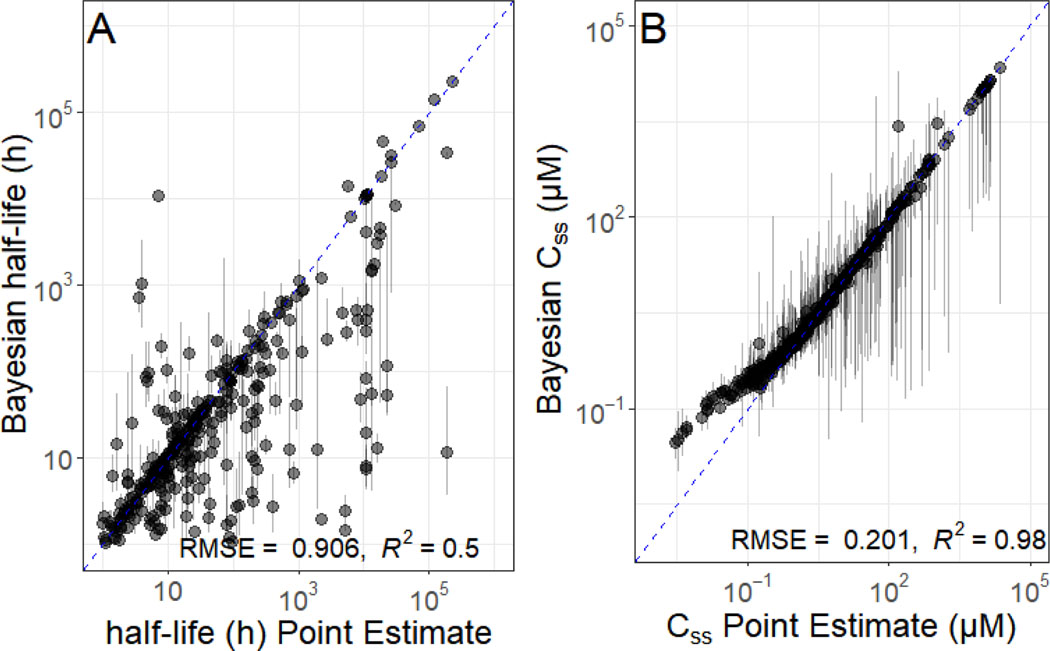
Figure 5.
Uncertainty Assessment for TK Quantities half-life and Css. The impact of uncertainty on estimated values for fup and Clint could in turn affect additional TK quantities, for example elimination half-life (t1/2, shown in panel A) and steady-state serum concentration (Css, shown in panel B). In both plots, the x-axis indicates the value that would have been estimated with previous methods, while the y-axis indicates the median and 95% credible interval for values calculated with our Bayesian method. Chemicals plotted with triangles are those that could be estimated with the previous, point estimate methods, while chemicals plotted with circles could not. The dashed line indicates the identity (perfect predictor) line. Chemicals that had no point estimate are plotted on the identity line.

