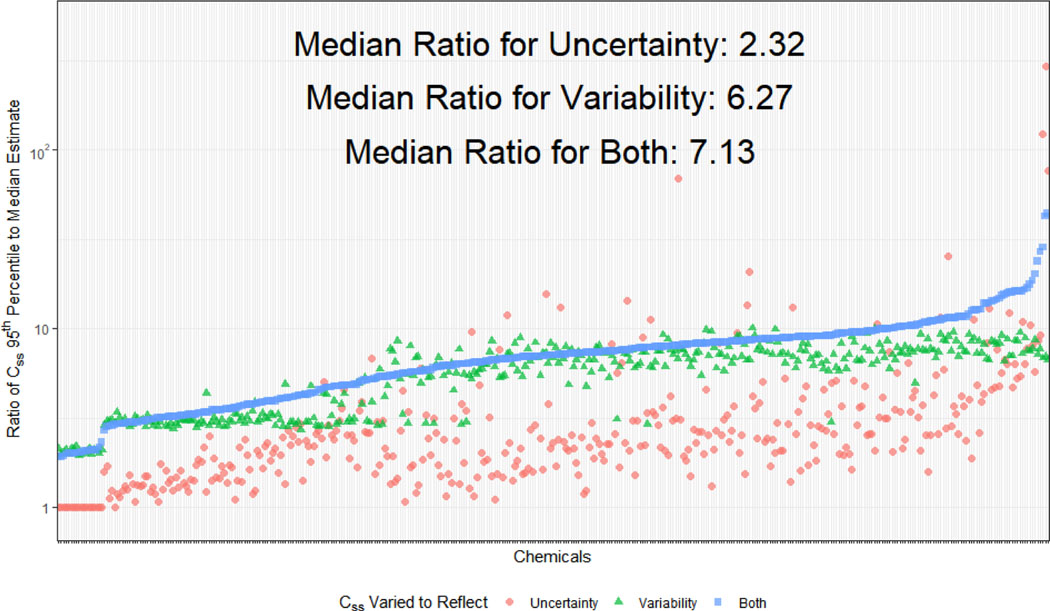
Figure 6.
Relative contributions of uncertainty and variability to differences between the 95th percentile and median Css. Monte Carlo analysis of both variability (triangles) and uncertainty (circles) give distributions that can be characterized by a 95th percentile Css for which individuals achieve a higher Css for the same fixed dose rate – these individuals can be considered more “sensitive” to chemical exposure. Uncertainty and variability can be combined (squares) to estimate a 95th percentile reflecting both factors. For most chemicals, variability contributes more than uncertainty to the difference between the Css predicted for the median Clint and fup values.

