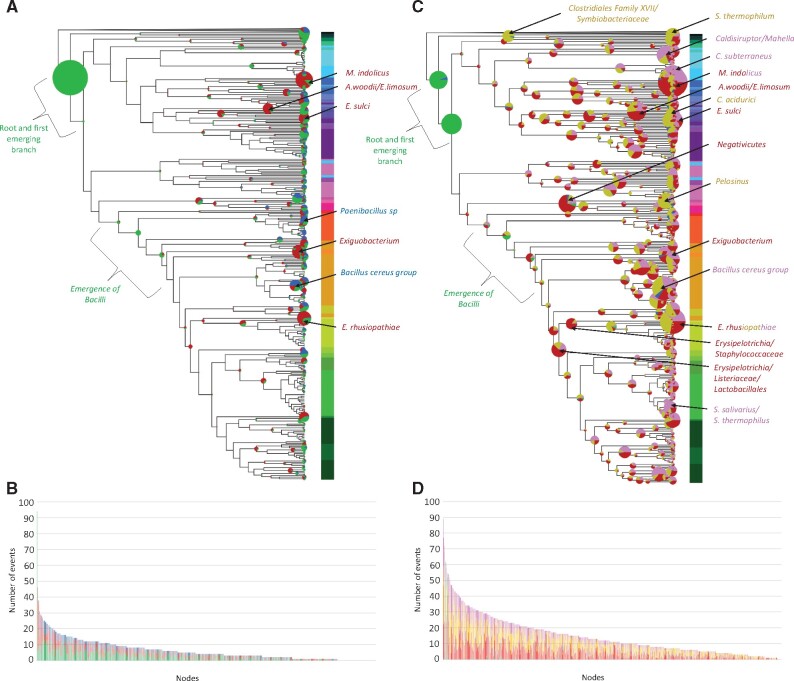
Fig. 2.
Evolutionary events that have impacted the 176 CDAP protein families during the diversification of Firmicutes.(A) Events inferred with the phylogenetic profile approach. (C) Events inferred with the reconciliation approach. Circles at branches correspond to inferred events. Their size is proportional to the number of events. Colors correspond to the type of evolutionary events: green = acquisitions, red = losses, blue = duplications, yellow = HGT, Pink = homologue replacements. Branches identified as hotspots are indicated by arrows. Colours associated to branch names correspond to the dominating type of events. (B) Distribution per branch of the number of events inferred with phylogenetic profiles. (D) Distribution per branch of the number of events inferred with reconciliation.

