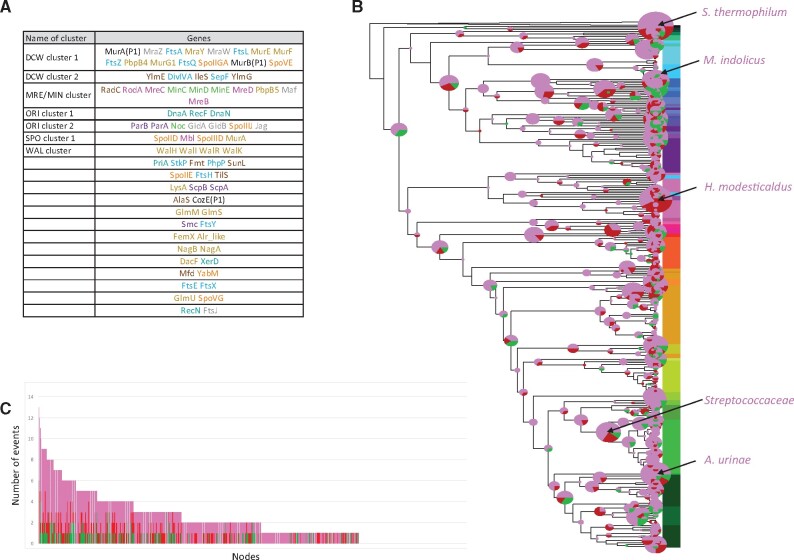
Fig. 3.
Evolution of CDAP gene clusters during the diversification of Firmicutes. (A) gene clusters inferred at the root of Firmicutes. Color of family names corresponds to the CDAP (blue: cell division, pink: elongation, yellow: cell wall, green: Z-ring localization, violet: chromosomal segregation, cyan: chromosome replication, orange: sporulation, blue-green: capsule synthesis, grey: peripherical). (B) Evolutionary event affecting gene clusters. Circles at branches correspond to inferred events. Their size is proportional to the number of events. Colors correspond to the type of evolutionary events: green = creations, red = disruptions, and pink = modifications. Branches identified as hotspots are indicated by arrows. Colors associated to branch names correspond to the dominating type of events. (C) Distribution of the number of events per branch.

