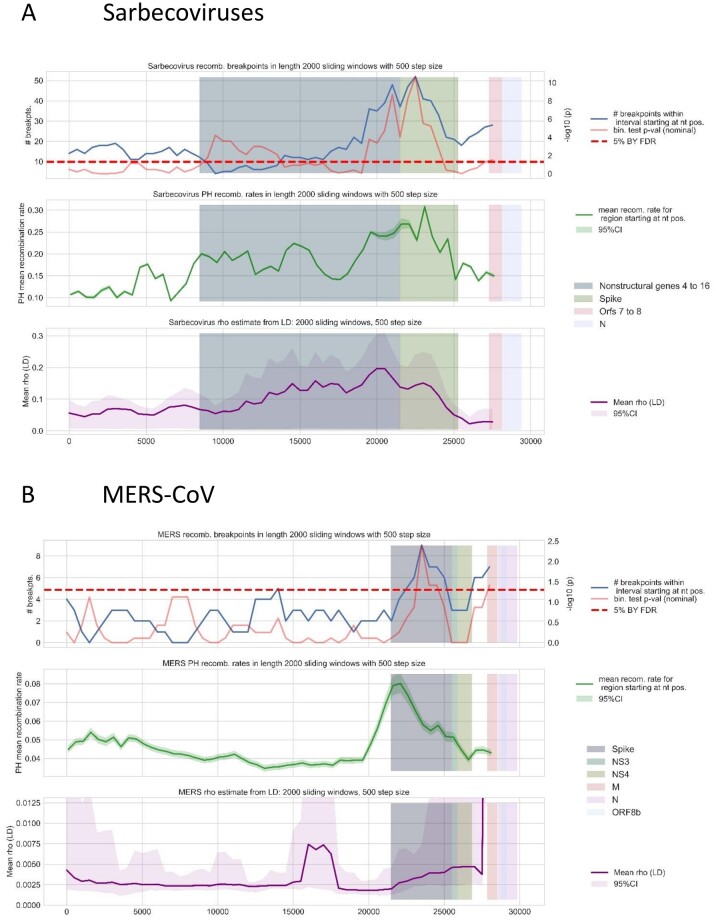
Fig. 3.
Conserved patterns of recombination of Sarbecoviruses (A) and MERS-CoV (B). Upper panel represents the mean number of recombination breakpoints detected at each window along the genome (blue) and the P-value obtained from the binomial tests (red). The dashed horizontal line represents the statistical significance threshold, set at 0.05. Middle panel (green line) represents the mean and 95% confidence interval for ρ (PH) inferred at each of these windows. Bottom panel (purple line) represents the mean and 95% posterior density interval for ρ (LD) inferred at each window. Highlighted genome regions represent coordinates of genes where binomial analyses detected significant windows.

