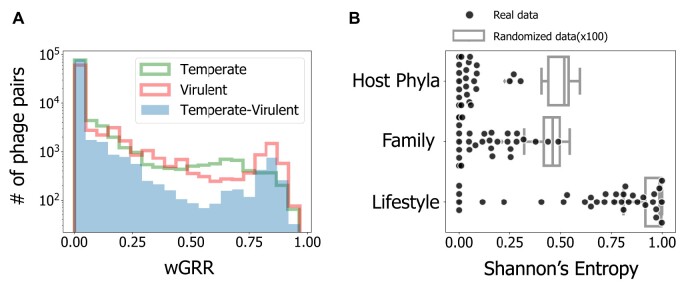
Fig. 1.
Results of the analysis of similarity between phages. (A) Histograms of the wGRR values (with wGRR > 0). (B) Shannon’s Entropy values for each cluster identified with the Louvain community detection method applied to the wGRR matrix. Results are given for the three phage traits (N = 34 for each trait, one per cluster). Boxplots represent the distribution of the concatenation of 100 repetitions of a process where phage lifestyles, hosts, and families are randomly assigned to each node (N = 3,400 for each trait). All distributions show significantly lower values (less heterogeneous clusters) than their random counterparts (all P < 0.0001, two-sample Kolmogorov–Smirnov test). The observed clusters have significantly higher values (more heterogeneous clusters) when analyzed in terms of phage lifestyle than in terms of other variables (both P < 0.001, Tukey HSD test). This data, and the data in all the other figures in the main text, refer to the data set with the phage’s lifestyle assigned with PHACTS. See supplementary figure S1, Supplementary Material online, for the analysis using only the subset of phages with a confidently assigned lifestyle in PHACTS (supplementary fig. S1A and C, Supplementary Material online) or with the phages’ lifestyle classified using BACPHLIP (supplementary fig. S1B and D, Supplementary Material online).

