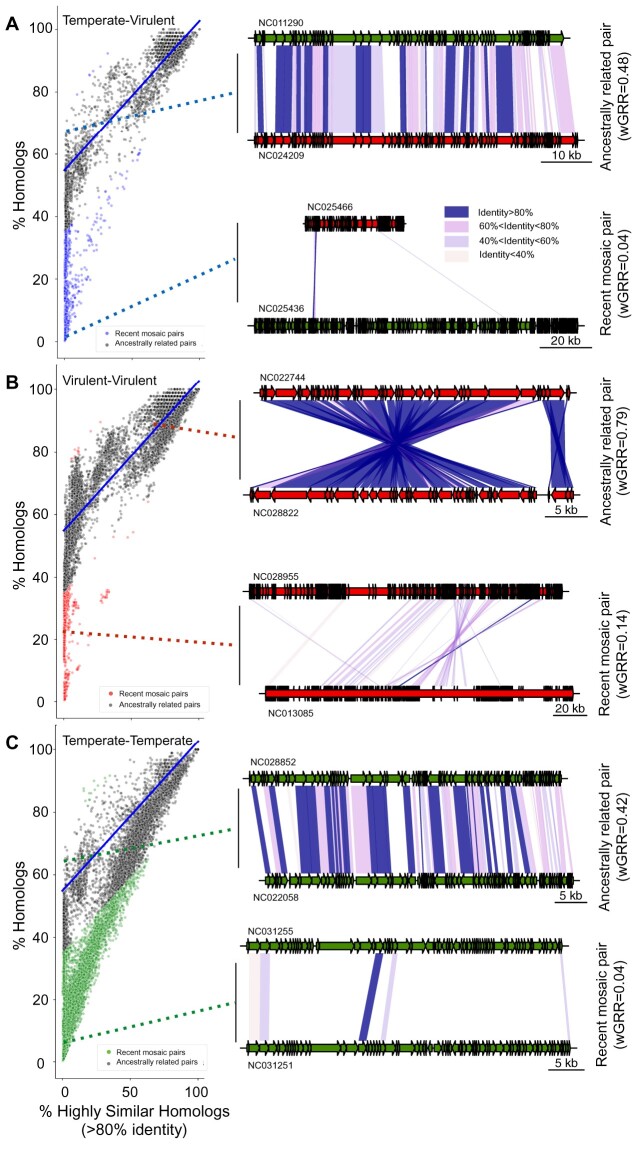
Fig. 2.
Identification of phage pairs with putative recent gene transfers. (A–C) Scatterplots of pairs of phage genomes, with recent mosaic pairs indicated as colored points (otherwise gray). The linear regression model (blue lines) was inferred for the temperate–virulent data set in (A) and applied to all data sets. The genomic maps show representative examples of one recent mosaic (bottom) or one ancestrally related phage pair (top), for each phage lifestyle combination (see more examples in supplementary fig. S7, Supplementary Material online). Dashed lines indicate the location of the phage pairs in the distributions on the left. Color codes for points and genes: virulent (red), temperate (green), virulent–temperate (blue). Colors in the blocks linking the phages indicate sequence similarity between homologs.

