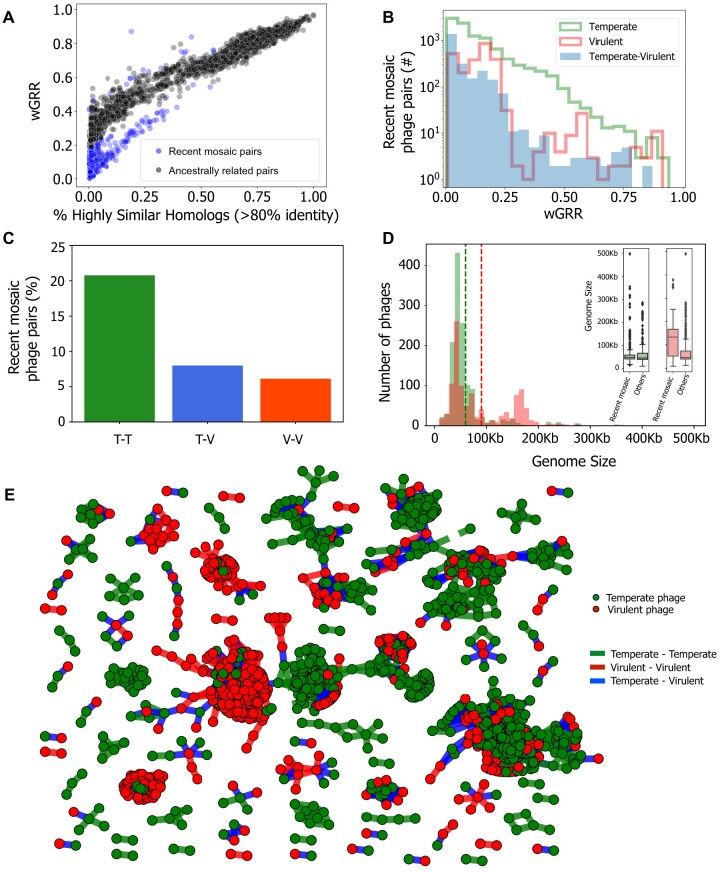
Fig. 3.
Identification of phage pairs with putative gene transfers in the wGRR network. (A) Scatterplot of pairs of temperate–virulent phages in terms of wGRR and the fraction of high sequence-identity homologous genes. (B) Histogram of wGRR values for the subset of recent mosaic phage pairs. (C) Frequency of recent genetic transfers within or between lifestyles, for pairs of phages with wGRR > 0.01 (P < 0.001 for association of genetic transfers with the phages’ lifestyle, χ2 test). T–T, temperate–temperate; T–V, temperate–virulent; V–V, virulent–virulent. (D) Distribution of the sizes of genomes of temperate (green), and virulent phages (red). Dashed lines indicate the average genome size for each lifestyle (in green, temperate phages, 59 kb; in red, virulent phages, 90 kb). In the inset, the boxplots show the distribution of genome sizes for the phages involved in recent transfers versus the genomes of the other phages, for each lifestyle. (E) Network of recent mosaic phages (i.e., those with wGRR < 0.5 in panel B). Each node represents a phage genome and each edge a relationship of genetic similarity. Temperate phages are shown in green nodes, virulent phages are shown in red nodes, and the edge colors correspond to events of gene transfer between temperate–temperate (green), temperate–virulent (blue), and virulent–virulent (red) phages.

