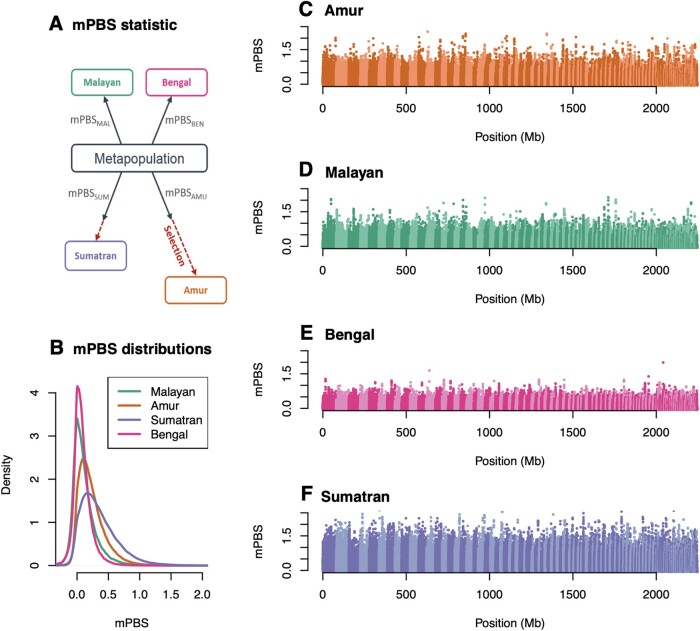
Fig. 4.
Genome scan for selection: (A) We present the mPBS statistic with a hypothetical model where the four populations diverge from a metapopulation, and where selection acts in both the Amur and Sumatra lineages and (B) the global distribution of observed mPBS for each population. Panels (C–F) correspond to the genome-wide distributions of the statistic for (C) Amur, (D) Bengal, (E) Malayan, and (F) Sumatran tigers as a function of the genomic position. Alternating light and dark colors indicate different scaffolds.

