. 2021 May 17;129(5):057008. doi: 10.1289/EHP8171

Figure 4.

disodium methyl arsonate hexahydrate Figure 4A is a set of five alpha smooth muscle actin stained cells titled control, sodium arsenite, monomethylarsonous acid, monomethylarsonic acid, and disodium methyl arsonate hexahydrate, depicting apolipoprotein E knockout mice exposed to 200 parts per billion arsenicals or maintained on tap water from conception to weaning where smooth muscle cell were evaluated in the aortic sinus relative to the total lesion area using lowercase alpha smooth muscle actin, with a 100-micrometer scale bar. Figures 4B to 4C are box plots titled smooth muscle cells-litter average, females, and males plotting lowercase alpha smooth muscle actin (percentage lesion area), ranging from 0 to 40 in increments of 10 (y-axis) across control, sodium arsenite, monomethylarsonous acid, monomethylarsonic acid, and disodium methyl arsonate hexahydrate (x-axis), respectively. Figure 4E is a set of five picrosirius red-stained cells titled control, sodium arsenite, monomethylarsonous acid, monomethylarsonic acid, and disodium methyl arsonate hexahydrate, depicting apolipoprotein E knockout mice exposed to 200 parts per billion arsenicals or maintained on tap water from conception to weaning where collagen content was evaluated in the aortic sinus relative to the total lesion area using lowercase picrosirius red stain, with a 100-micrometer scale bar. Figures 4F to 4H are box plots titled collagen-litter average, females, and males plotting collagen (percentage lesion area), ranging from 0 to 60 in increments of 20 (y-axis) across control, sodium arsenite, monomethylarsonous acid, monomethylarsonic acid, and disodium methyl arsonate hexahydrate (x-axis), respectively.

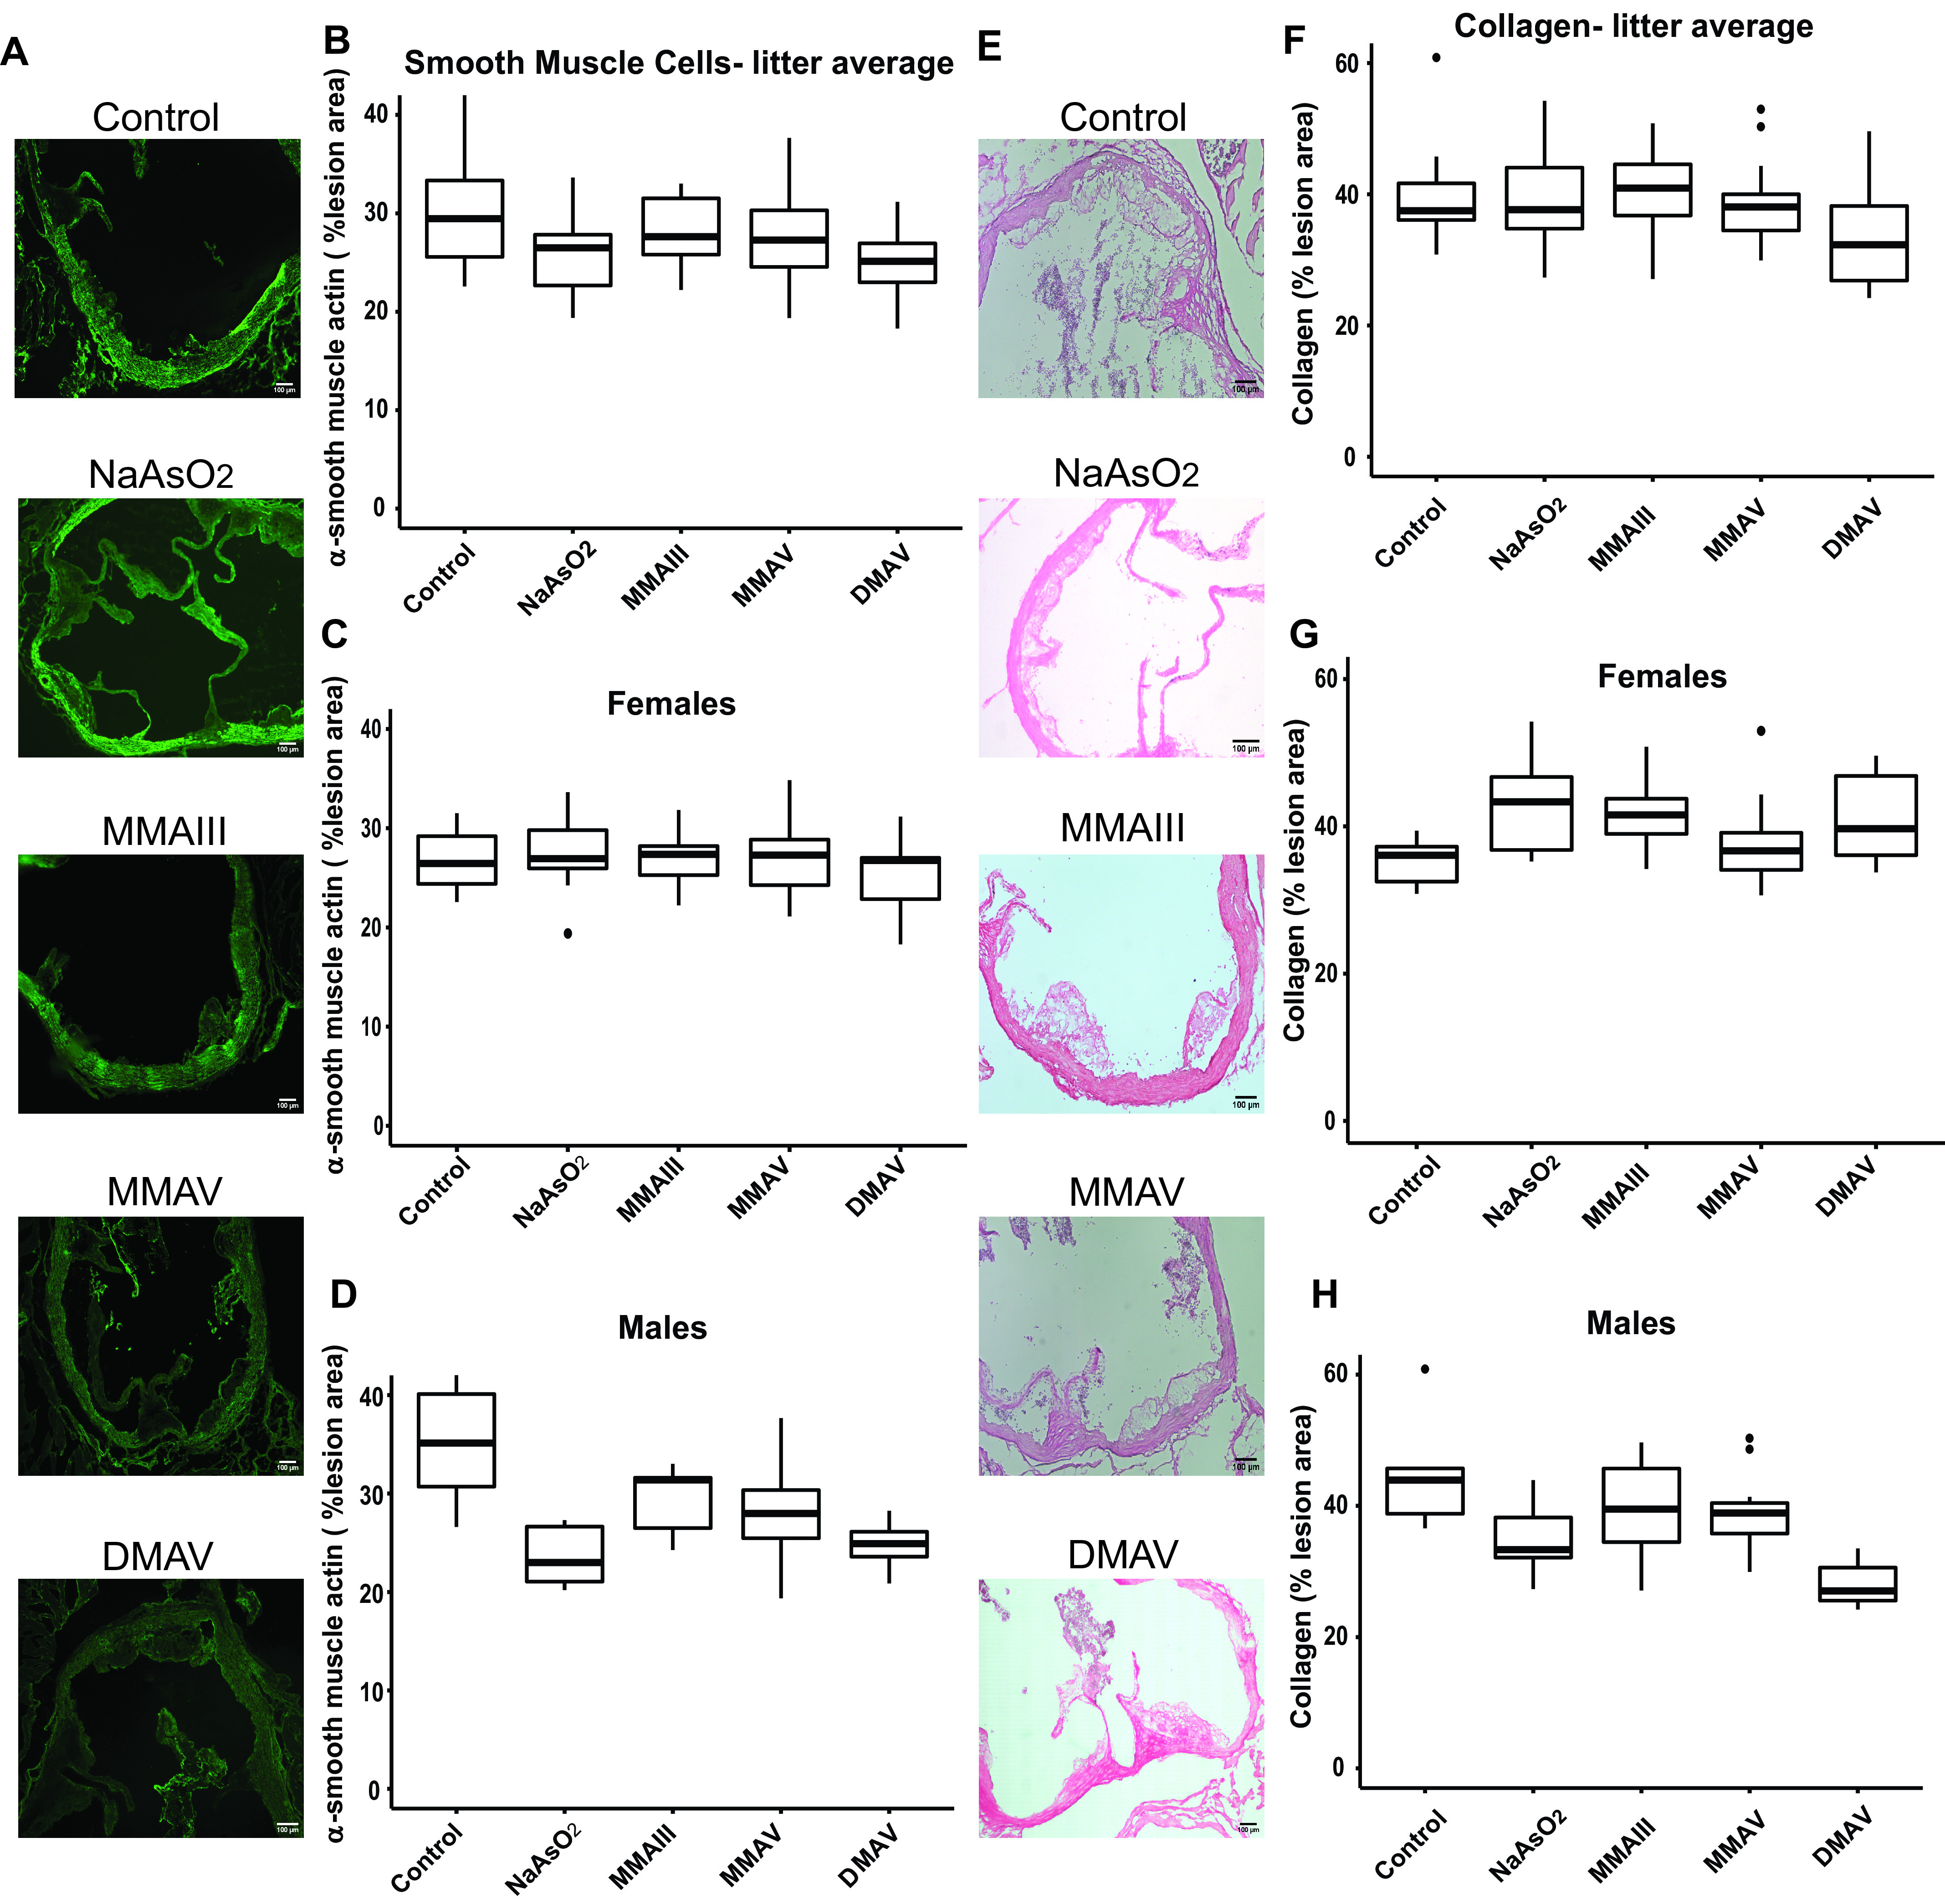
Differences in plaque SMC and collagen content in the aortic sinus in adult apoE/ mice following early life arsenical exposure. ApoE/ mice were exposed as described for Figure 1. (A–D) SMC and (E–H) collagen content were evaluated in the aortic sinus relative to the total lesion area using α-smooth muscle actin and picrosirius red staining, respectively. Scale bar: 100μm. (B) Represents the data distribution of the unadjusted percentage of SMCs with respect to the total sinus area for all offspring in the control and arsenical-exposed groups, whereas (C) and (D) represent that in the female and male offspring, respectively. (E) Represents the data distribution of the unadjusted percentage of collagen content with respect to the total sinus area for all offspring in the control and arsenical-exposed groups, whereas (F) and (G) represent that in the female and male offspring, respectively. The midline, box limits, whiskers, and dots denote the median, interquartile range, minimum and maximum values, and outliers, respectively. The corresponding numeric data are presented in Table S5 and that adjusted by litter are presented in Tables 4 and 5. Note: DMAV, cacodylic acid; MMAIII, monomethylarsonous acid; MMAV, disodium methyl arsonate hexahydrate; NaAsO2, sodium arsenite; SMC, smooth muscle cell.