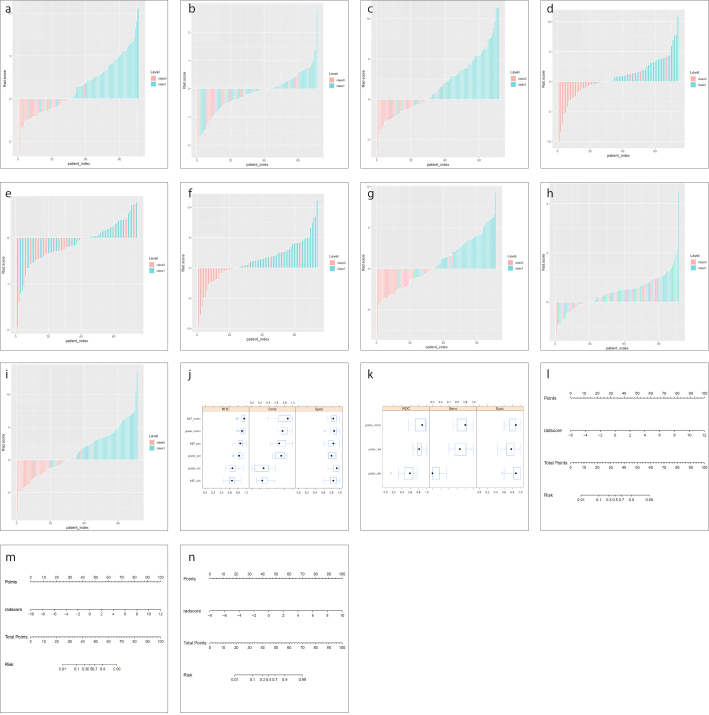
Figure 6. a–n.
The predictive performance of the radiomics score, clinical factors and their combination. The bar plots for the training cohort show the radiomics scores, clinical factors and their combination for each patient categorized by LGGs and HGGs (a–c), grade III and grade IV gliomas (d–f), and low Ki-67 and high Ki-67 (g–i). The boxplots show the radiomics scores, clinical factors and their combination in training cohort categorized by LGGs and HGGs (j), low Ki-67 and high Ki-67 (j), and grade III and grade IV gliomas (k). The radiomics nomogram developed in the training cohort with the radiomic score, age and red cell distribution width (RDW) of every patient to detect LGGs and HGGs (l), grade III and grade IV gliomas (m), and low Ki-67 and high Ki-67 (n).

