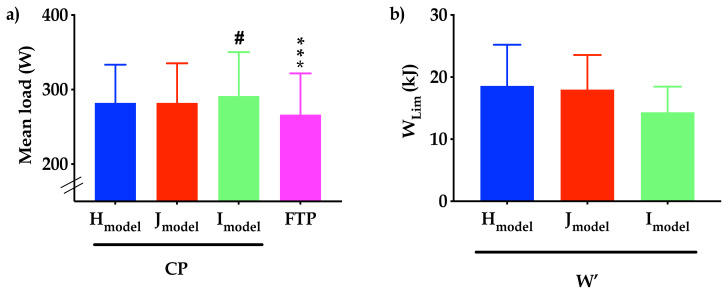
Figure 2.
Bar graphs of mean and standard deviation data for a) CP using Hmodel, Jmodel, and Imodel versus FTP and b) W’ using Hmodel, Jmodel, and Imodel. Asterisk (*) symbol infers significantly lower than CP using Hmodel, Jmodel, and Imodel, *** infer p < 0.001, hash-tag (#) symbol infers CP significantly higher than Hmodel, # infer p < 0.05.

