
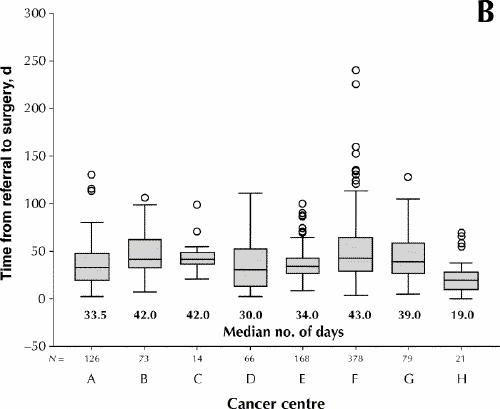
Fig. 1: Waiting times from referral to surgery, by type of cancer (A) and by cancer centre (B), for 925 cases treated by surgeons affiliated with regional cancer centres in Ontario. Lower and upper portions of the boxes represent the 25th and 75th percentiles, respectively; the midline marks the median; the projecting lines represent the most extreme values in the data set that were not more than 1.5 times the height of the box beyond either quartile; the circles represent outliers.