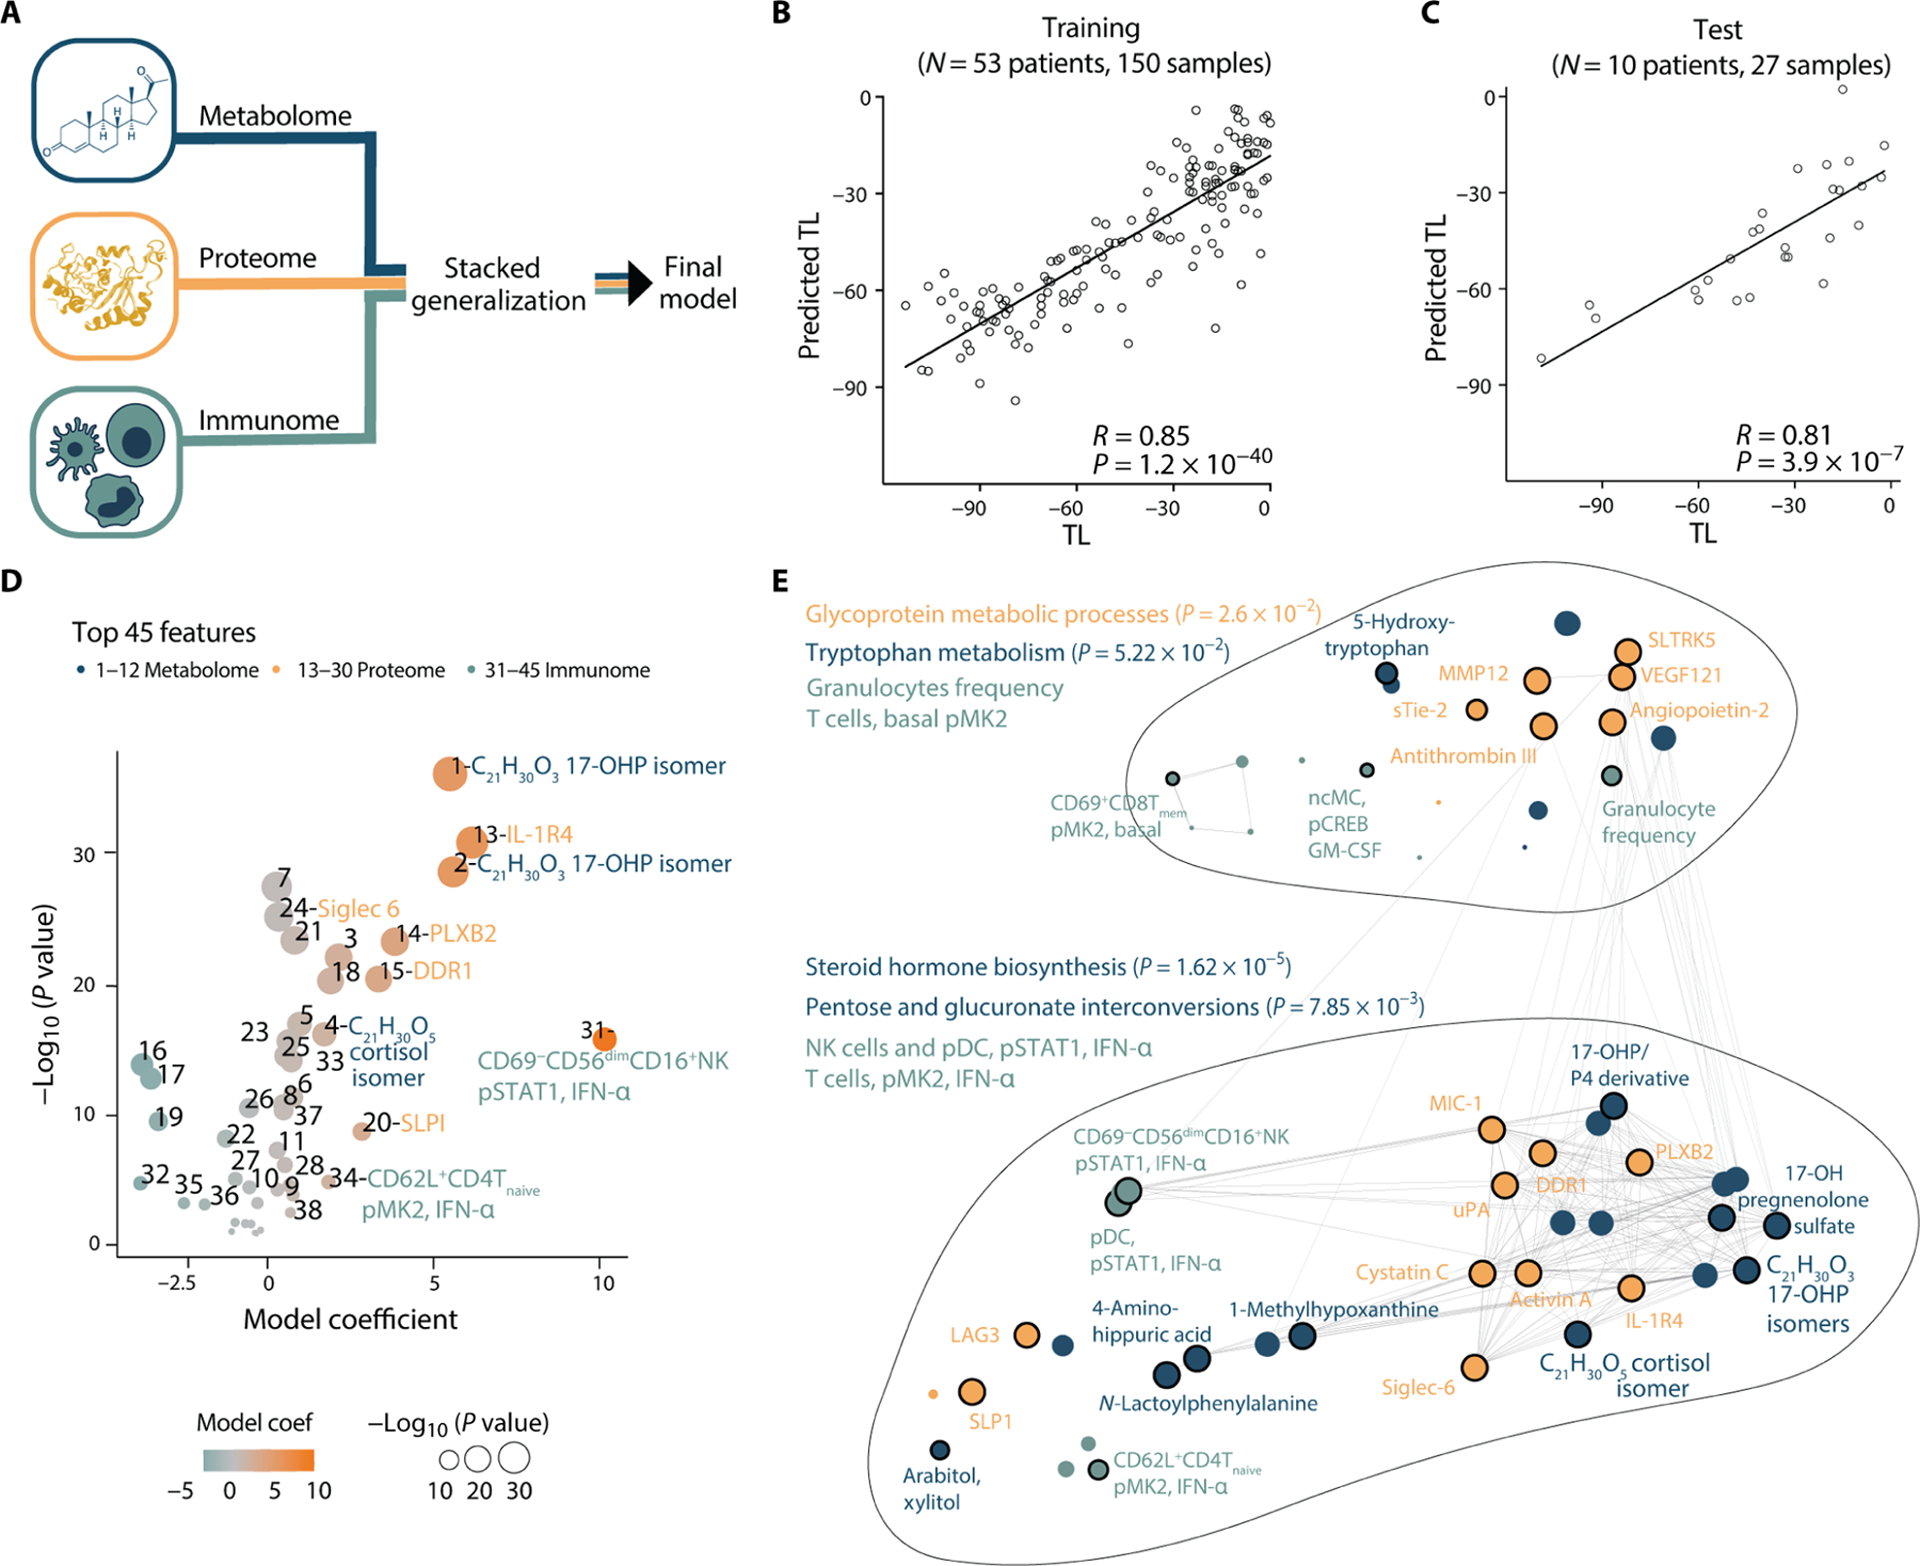
Fig. 3. Multiomic modeling of the maternal interactome predicts labor onset.

(A) Integration of all three modalities (metabolome, proteome, and immunome) using a stacked generalization (SG) method. (B and C) Regression of predicted versus true TL (days) derived from the SG model [training cohort, Pearson R = 0.85, 95% CI [0.79 to 0.89], P = 1.2 × 10−40, RMSE = 17.7 days, N = 53 patients (B); test cohort, Pearson R = 0.81, 95% CI [0.61 to 0.91], P = 3.9 × 10⁻⁷, RMSE = 17.4 days, N = 10 patients (C)]. (D) Volcano plot depicting the 45 most informative SG model features in the training cohort. Feature importance to the overall predictive model is plotted on the x axis (SG model coefficient), correlation with the TL is plotted on the y axis [−Log10 (P value)]. Orange colors depict positive correlations with the TL, and teal colors depict negative correlations. See table S3 for number-to-feature key. (E) Pathway enrichment analysis was performed on metabolic and proteomic top SG model features (see Materials and Methods; P values derived from hypergeometric and Fisher’s test). All 45 most informative model features are depicted in a correlation network to visualize interomic correlations (edges indicate an absolute R > 0.46, N = 53). See also Fig. 4, fig. S1, and table S3.
