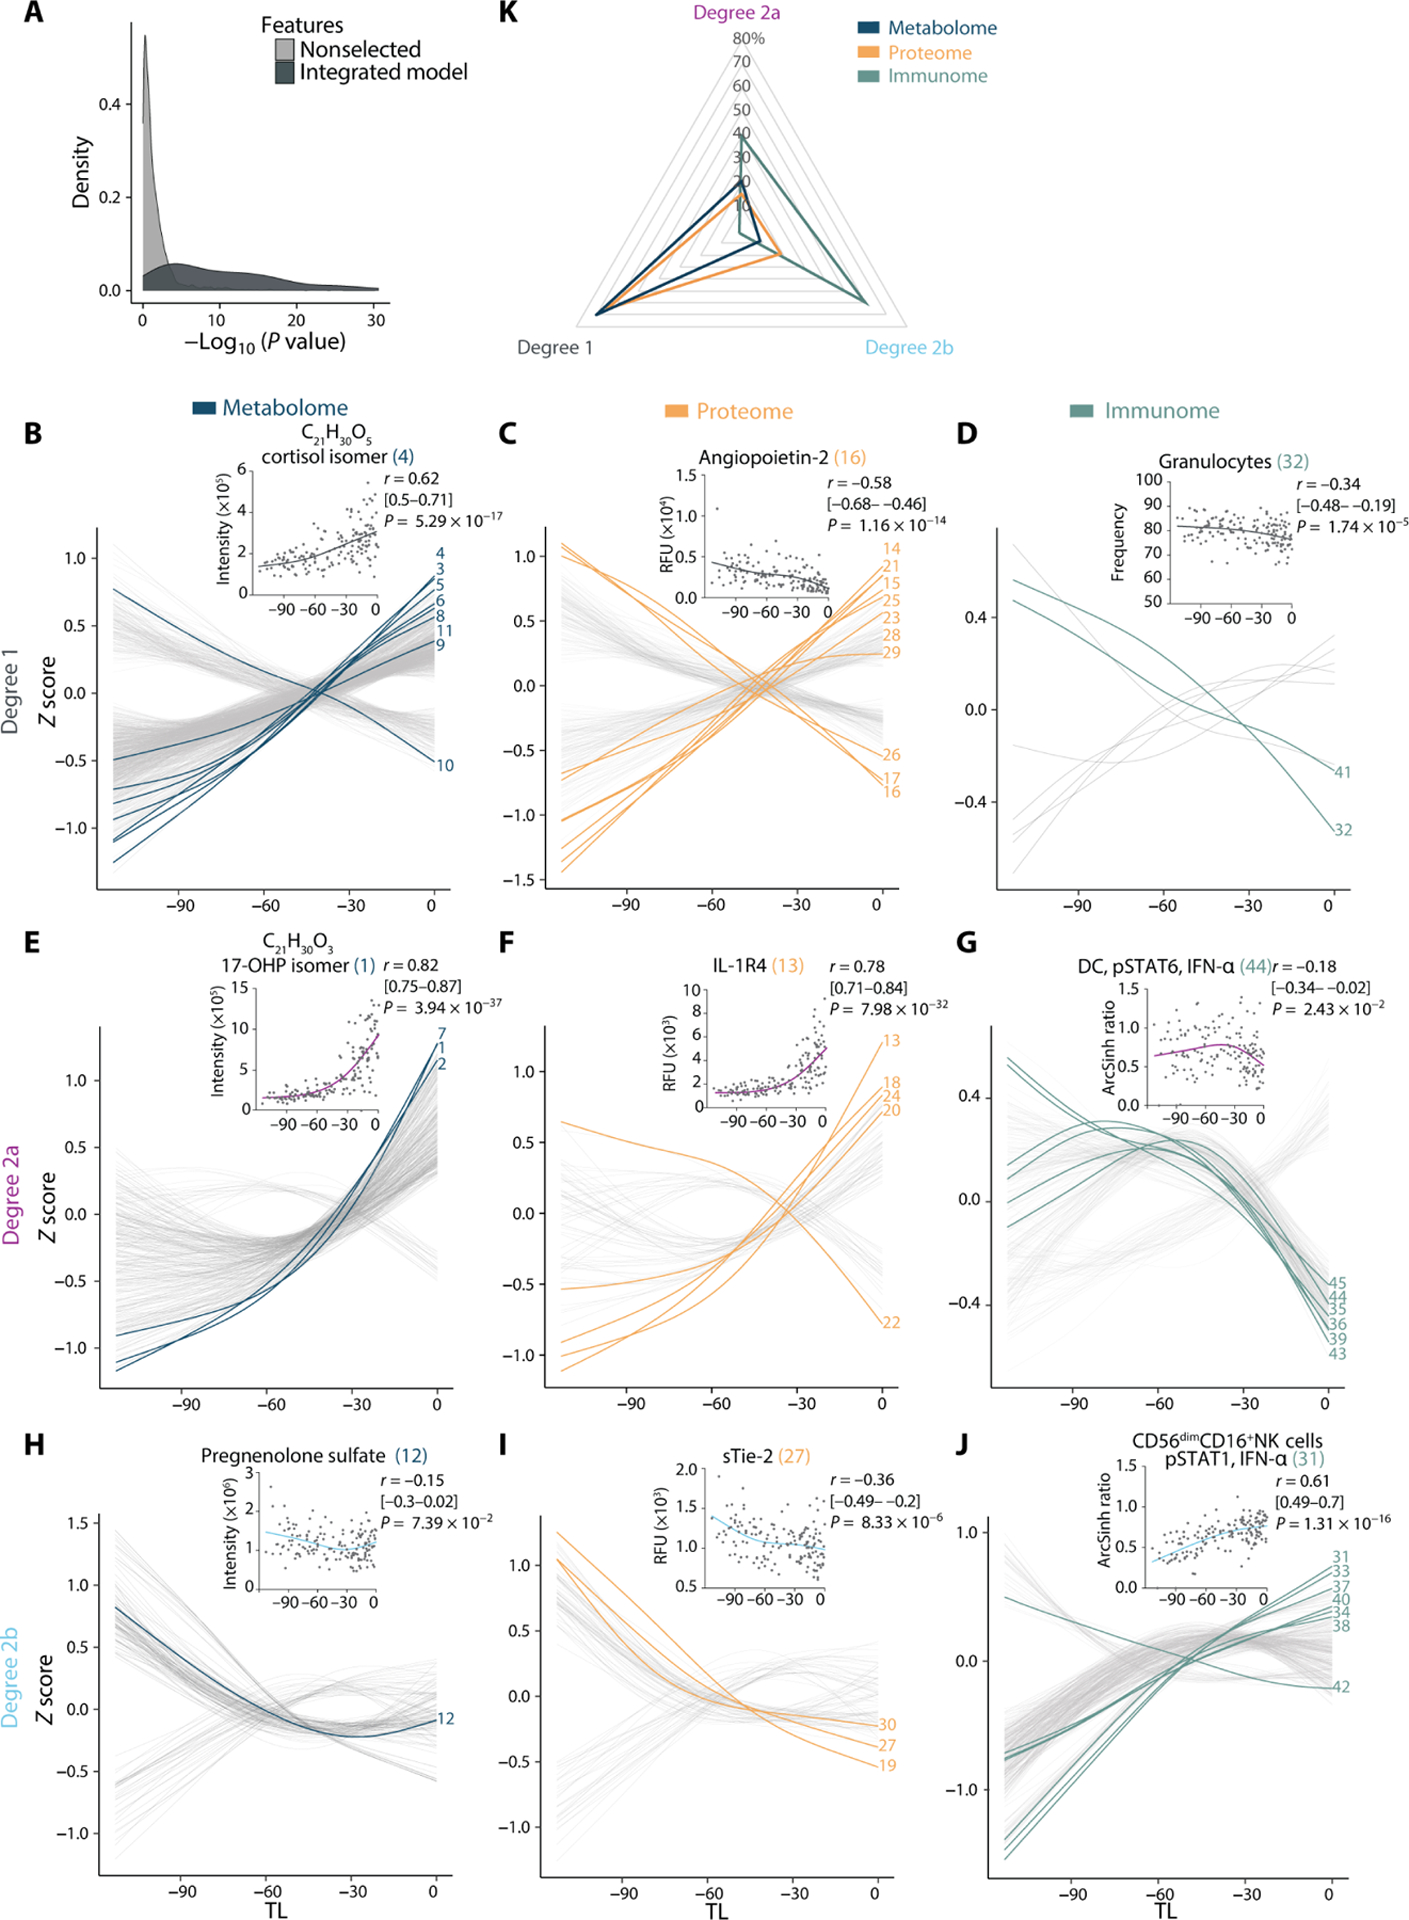
Fig. 4. Trajectories of the maternal metabolome, proteome, and immunome reveal alterations in prelabor dynamics.

(A) Distribution of relevance-of-fit P values for the trajectories assigned to SG model features in comparison to nonselected features demonstrates goodness of fit of curve classification (N = 53 patients, n = 150 samples). Feature trajectories were classified as linear or quadratic on the basis of the goodness of fit with Akaike information criterion and relevance of fit with associated P value (F statistic). Degree 1 (B to D), degree 2a (E to G), or degree 2b (H to J) trajectories are plotted over time for the metabolome (left), proteome (middle), and immunome (right). Lines represent smoothened spline (df = 3, Z-scored) for all features. The most informative model features are highlighted and numbered (in reference to Fig. 3D and table S3). A representative feature is shown (inset) for each trajectory type including its correlation with TL (Spearman coefficient [95% CI], and associated P value). (K) Radar plot quantifying the distribution of degree 1 (linear), degree 2a [quadratic, accelerating (surging of an increasing or decreasing pattern over time)], and degree 2b [quadratic, decelerating (plateauing of an increasing or decreasing pattern over time)] trajectories among all multiomic features. See also figs. S2 to S6 and tables S3 and S4.
