Figure 3.

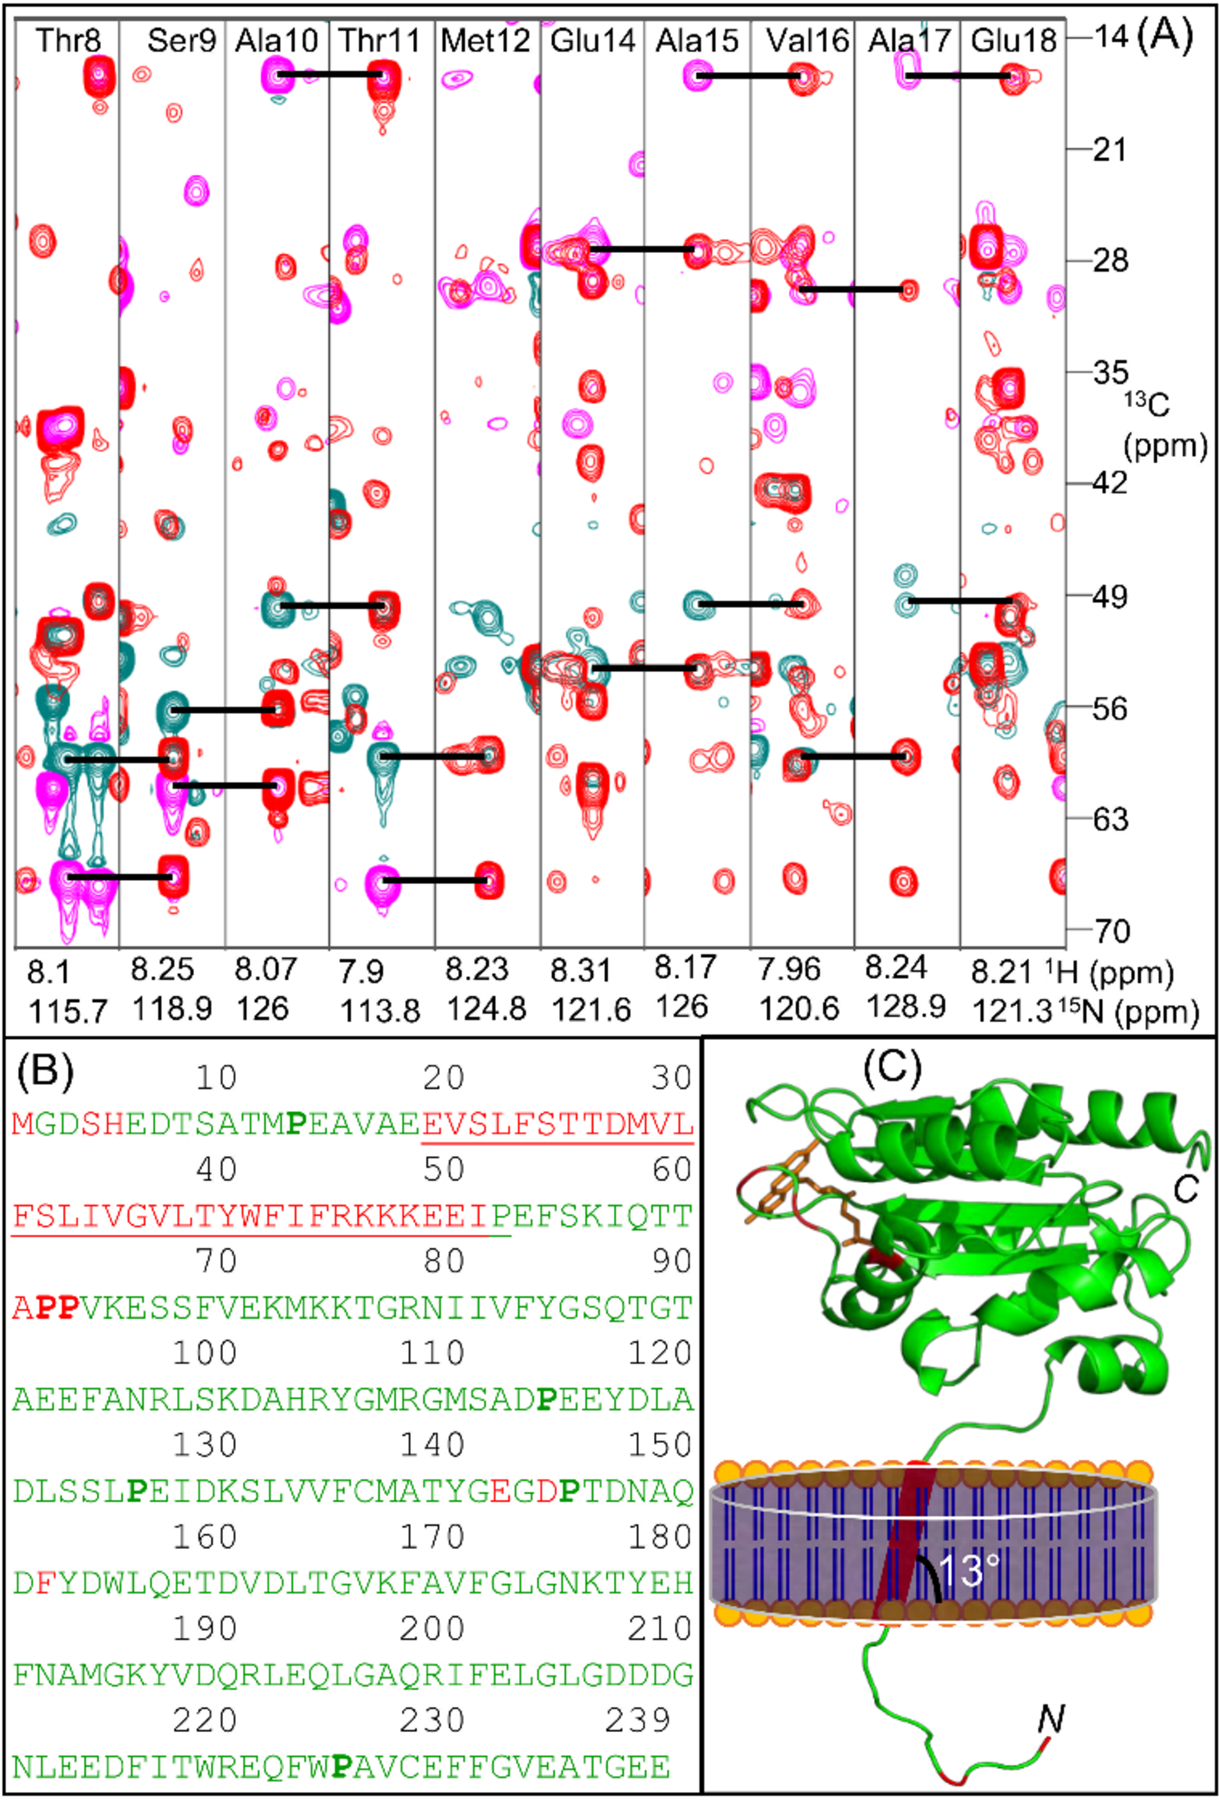
(A) Overlay of two-dimensional F1(13C)-F2(15N) strip plots obtained from three-dimensional HNCACB and CBCA(CO)NH spectra for the amino acid residues from Thr8 to Met12 and Glu14 to Glu18. Sequential intra-residue Cα (cyan) and Cβ (magenta) resonances in HNCACB are connected to corresponding inter-residue resonances in CBCA(CO)NH (red) using horizontal lines. NMR spectra were collected at 25 °C on a DMPC-nanodisc sample of 0.3 mM 13C-,15N-labelled full-length FBD in 40 mM potassium phosphate buffer (pH 7.4) containing 0.01% sodium azide. (B) Amino acid sequence of the full-length FBD highlighting the assigned residues colored in green, the unassigned residues colored in red and the transmembrane domain that is flanked by the short N-terminal region and the large C-terminal soluble domain is underlined. The proline residues are shown in bold. (C) Mapping the assigned residues on to the structure of FBD lacking the N-terminal region and the transmembrane domain (PDB id: 1AMO). The N-terminal region and the transmembrane domain are schematically shown. N- and C- indicate N- and C-termini, respectively. The prosthetic group ‘FMN’ is colored in orange.
