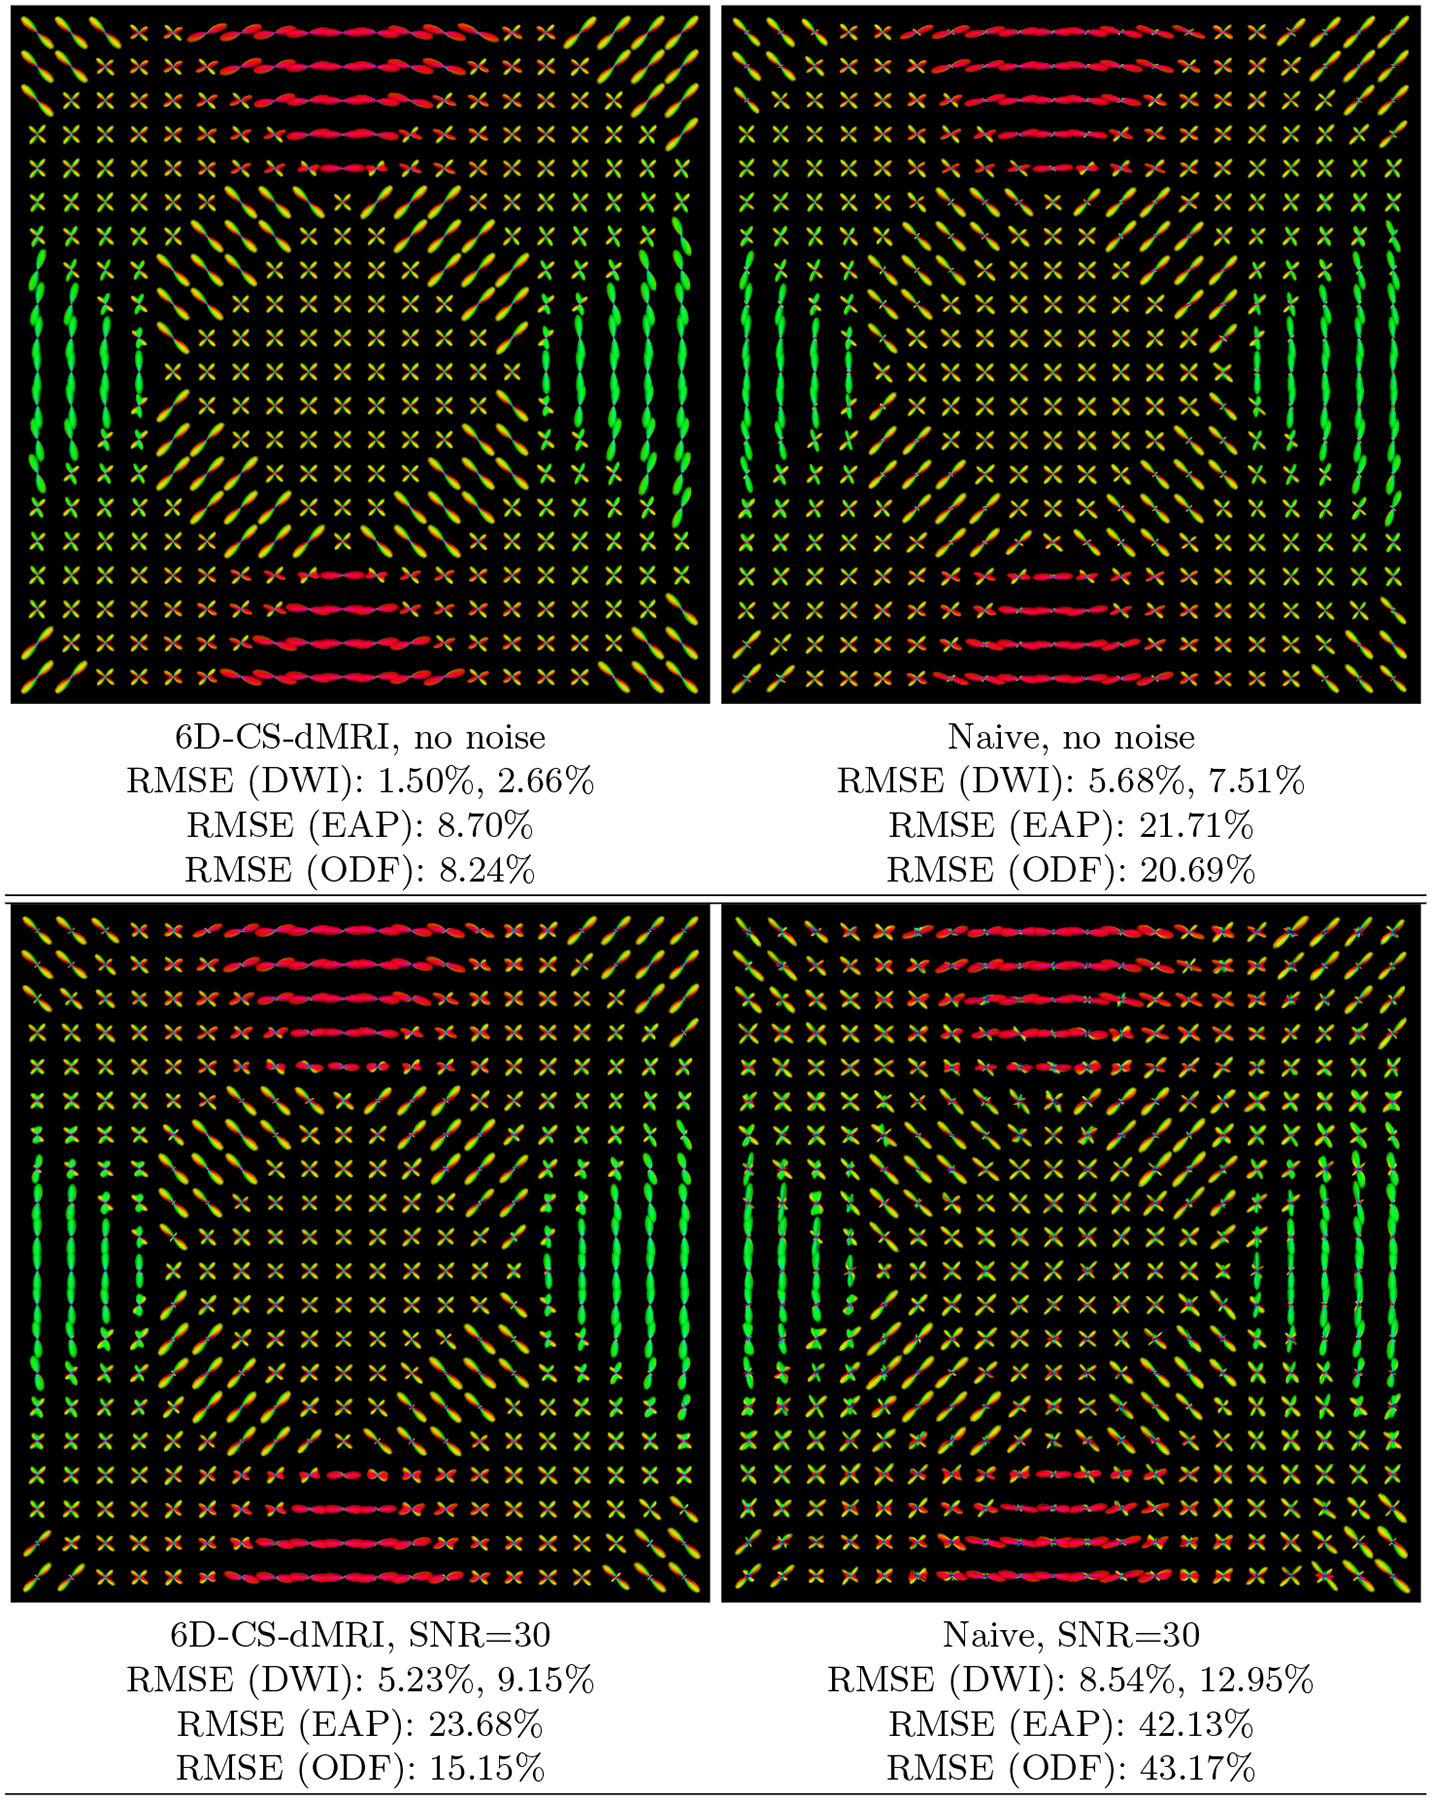
Fig. 2. Synthetic Data Experiment.

Visualization of the estimated EAP profiles with 15μm by 6D-CS-dMRI and naive 6D-CS-dMRI using 11-fold sub-sampling of the raw data, without and with complex Gaussian noise. Also shown are the RMSEs for ODFs and EAPs, and two RMSEs for DWI signal, where the first one is calculated for a single shell and the second one for the 3D space.
