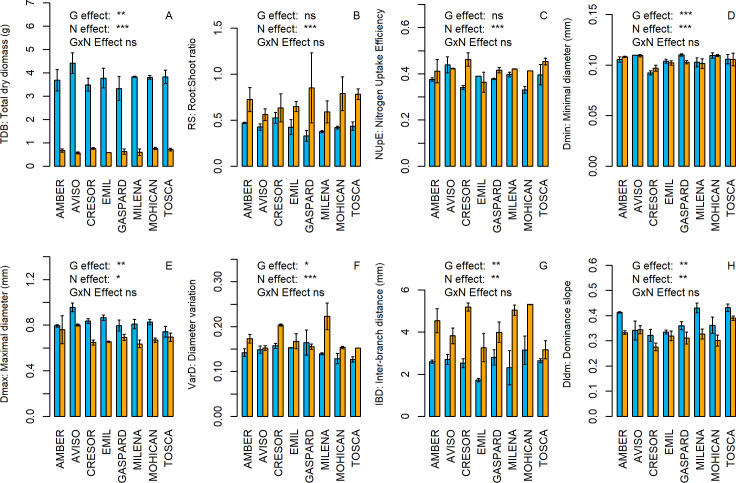
Fig 2. Genotypic variability of 5 RSA traits and 3 PA traits under N+ and N- treatments.
Barplots showing mean trait values for each genotype under the two nitrogen levels on total dry biomass (A), Root:Shoot ratio (B), Nitrogen Uptake Efficiency (C), root minimal diameter (D), root maximal diameter (E), Inter-Branch distance(F), root system dominance (G) and lateral root diameter variation (H). Significant effect of genotype, nitrogen treatment and interaction between genotype and nitrogen treatment were assessed through an ANCOVA (***: pvalue < 0.001; **: pvalue < 0.01; *: pvalue < 0.05; ns: pvalue > 0.05). Orange bars stand for N- plants and blue bars stand for N+ plants (n = 2). Error bars represent standard errors (+/- SE).

