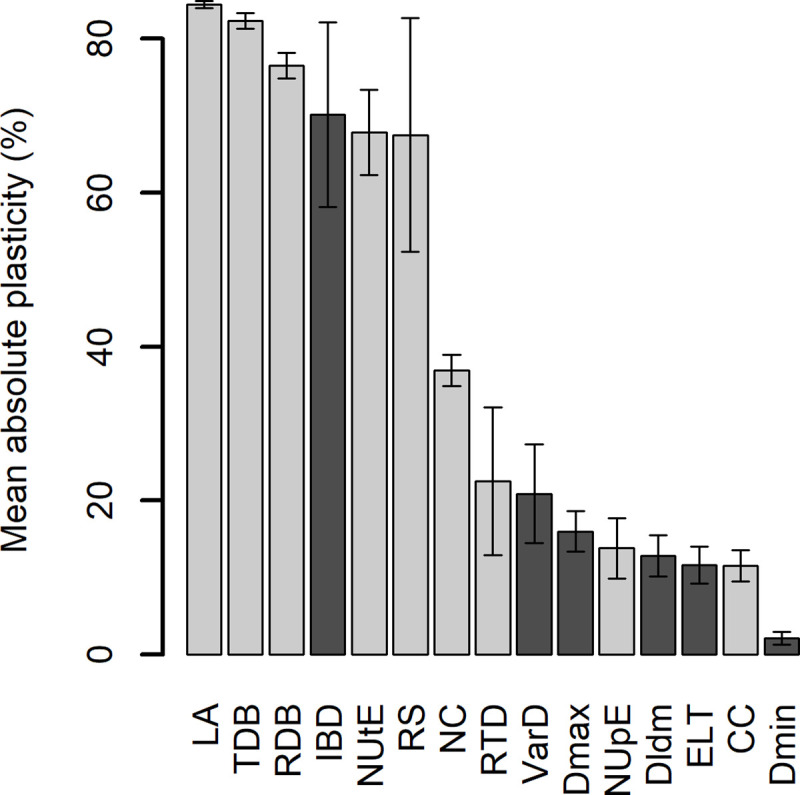
Fig 4. Absolute plasticity of the 15 measured traits in response to N limitation, averaged by pooling the eight genotypes.

LA: Leaf Area; TDB: Total Dry Biomass; RDB: Root Dry Biomass; IBD: Inter-Branch distance; NUtE: Nitrogen Utilization Efficiency; RS: Root:Shoot Ratio; NC: Nitrogen Content; RTD: Root Tissue Density; VarD: Lateral root diameter variation; Dmax: Root maximal diameter; NUpE: Nitrogen Uptake Efficiency; Dldm: Root Hierarchy; ELT: Root elongation rate by root diameter; CC: Carbon Content; Dmin: Root minimal diameter. Dark bars represent RSA traits while light bars represent PA traits. Error bars are standard errors of the mean (n = 8).
