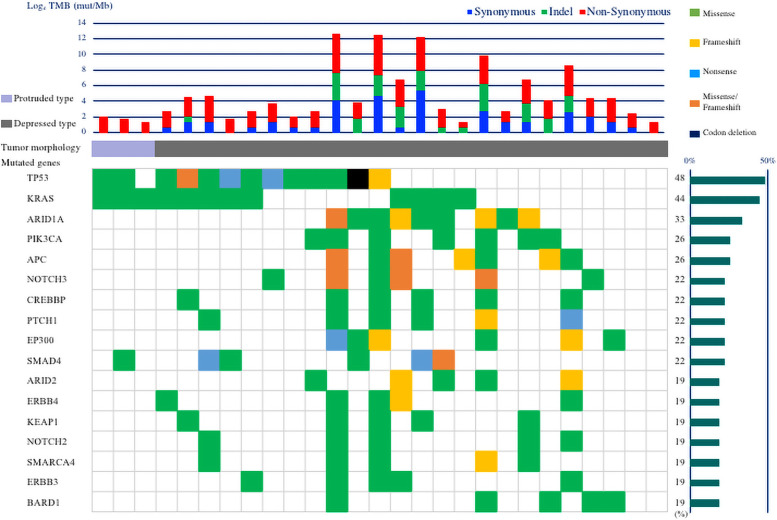
Fig 1. Genomic landscapes of 27 small-bowel cancers.
Upper panel: Number of somatic mutations per sample. Blue bars indicate the number of synonymous mutations, green bars indicate the number of insertions/deletions (indels), and red bars indicate the number of non-synonymous mutations. Middle panel: Morphology of lesions. Light purple bars indicate protruded type tumor morphology (defined as Type 1 morphology) and gray bars indicate depressed type tumor morphology (defined as Type 2 and Type 3 morphology). Lower panel: Mutation pattern of 17 mutated genes with a frequency >15% from 27 small-bowel cancers. Mutated genes are shown. Green cells indicate missense mutations, yellow cells indicate frameshift mutations, light blue cells indicate nonsense mutations, orange cells indicate missense/frameshift mutations, and black cells indicate codon deletions. The bar graph on the right indicates the frequency of each mutated gene of small-bowel cancers.

