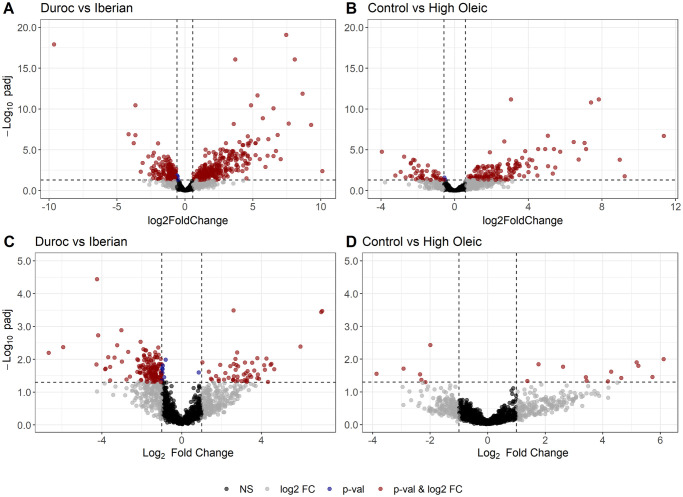
Fig 5. DA volcano plots.
Volcano plots of differentially abundant OTUs using DESeq2 (A, B) and ALDEx2 (C, D), for breed (left) and diet (right) contrasts. Red dots represent OTUs with an adjusted p-value below the FDR cut-off (0.05) and a FC value above 1.5 or below -1.5 for DESeq2 contrasts, or a median difference between CLR values above 1 or below -1 for ALDEx2 contrasts. OTUs with Log2(FC) < 0 or diff.btw < 0 are more abundant in Duroc and Control groups, respectively.

