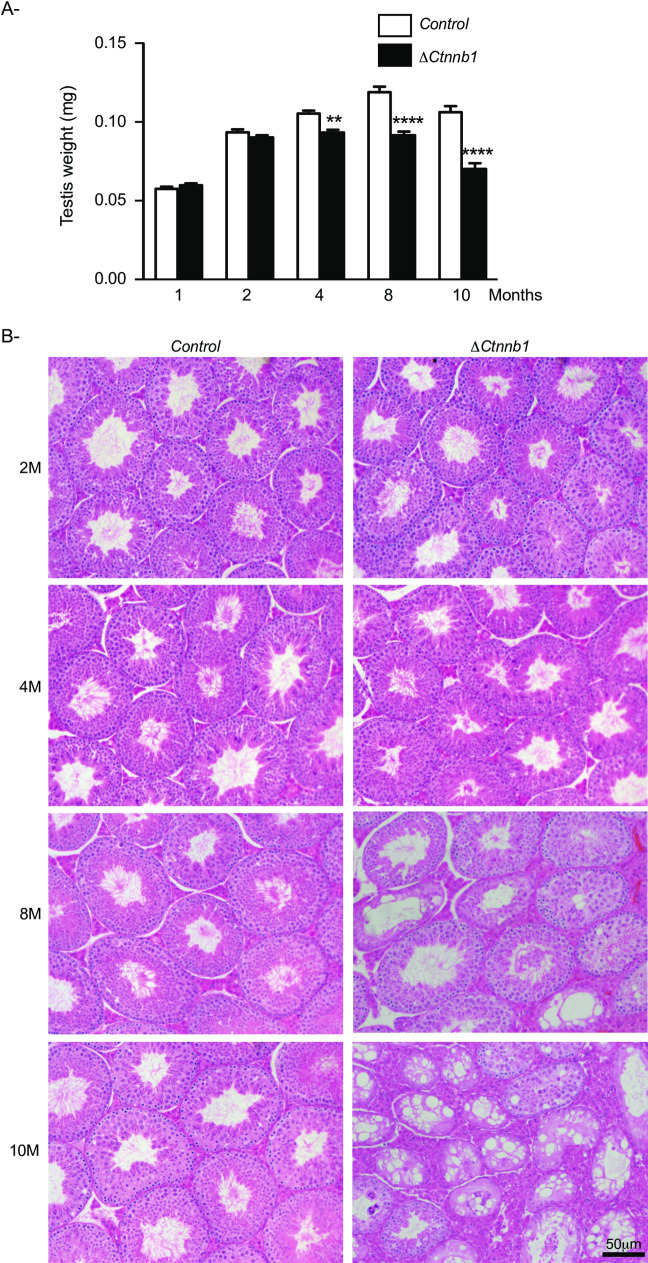
Fig 2. Loss of spermatogenesis in the seminiferous tubules of ΔCtnnb1 mice.
A) Time course analysis of testicular weight comparing ΔCtnnb1 to control mice at the indicated ages. Sample numbers analyzed varied by age and genotype. Values for ΔCtnnb1 are 1M: n = 4; 2M: n = 6; 4M: n = 14; 8M: n = 8; 10M: n = 14; values for control are 1M: n = 4; 2M: n = 8; 4M: n = 18; 8M: n = 8; 10M: n = 12. Data are expressed as means (columns) ± SEM (error bars). Asterisks indicate significant differences from controls (** P < 0.01; **** P < 0.0001). B) Photomicrographs comparing testicular histology of ΔCtnnb1 to control mice at the indicated ages. Scale bar (lower right) is valid for all images; Hematoxylin and Eosin staining.

