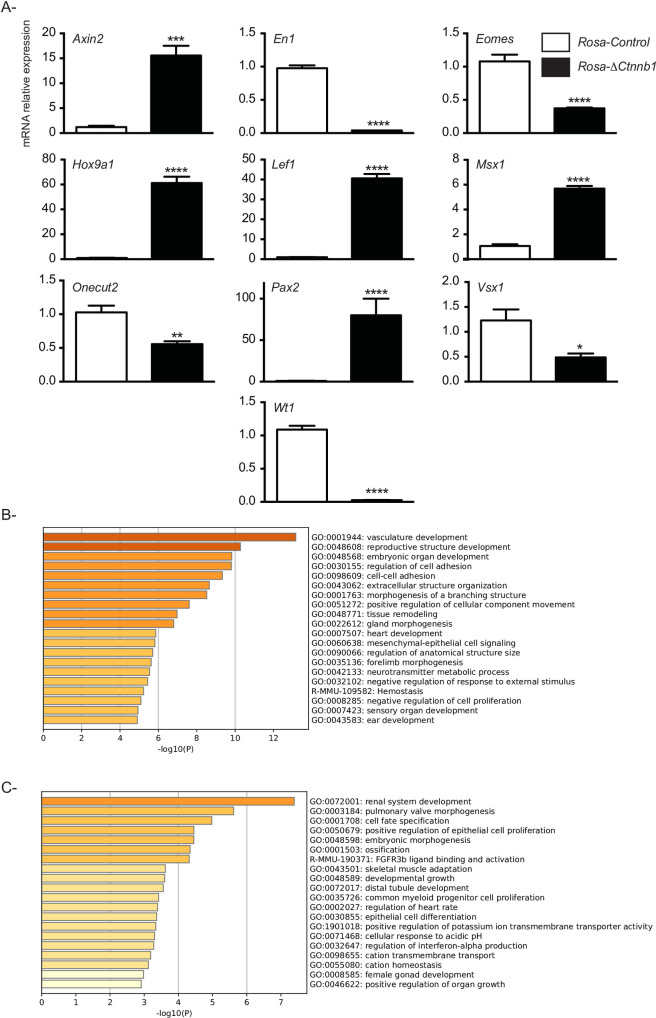
Fig 6. CTNNB1 stabilization mainly affects developmental gene expression.
A) Validation of the RNAseq data by RT-qPCR analysis (n = 6 for Rosa-control and n = 6 Rosa-ΔCtnnb1). RT-qPCR data were normalized to the housekeeping gene Rpl19. All data are expressed as mean (columns) ± SEM (error bars). Asterisks indicate significant differences from controls (*P < 0.05; **P < 0.01; *** P < 0.001; **** P < 0.0001). B, C) Biological processes associated with upregulated (B) or downregulated (C) genes in Thy1-positive cell clusters derived from Rosa-ΔCtnnb1 mice using Metascape.

