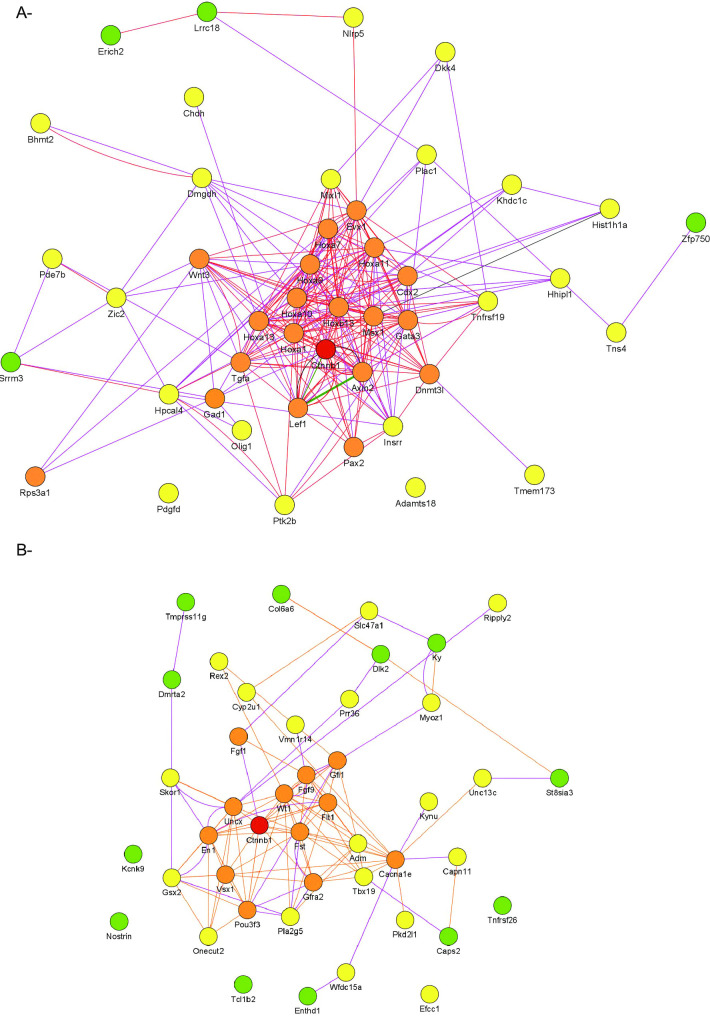
Fig 7. CTNNB1 regulates an important network of genes in spermatogonia.
A) Gene network analysis of the 50 most upregulated genes in Thy1-positive cell clusters derived from Rosa-ΔCtnnb1 mice. B) Gene network analysis of the 50 most downregulated genes in Thy1-positive cell clusters derived from Rosa-ΔCtnnb1 mice. Lines, orange = predicted interactions, purple = co-expression, green = genetic interaction, red = pathway, black = physical interaction. Circle; orange = first neighbor, yellow = second neighbor, green = third neighbor.

