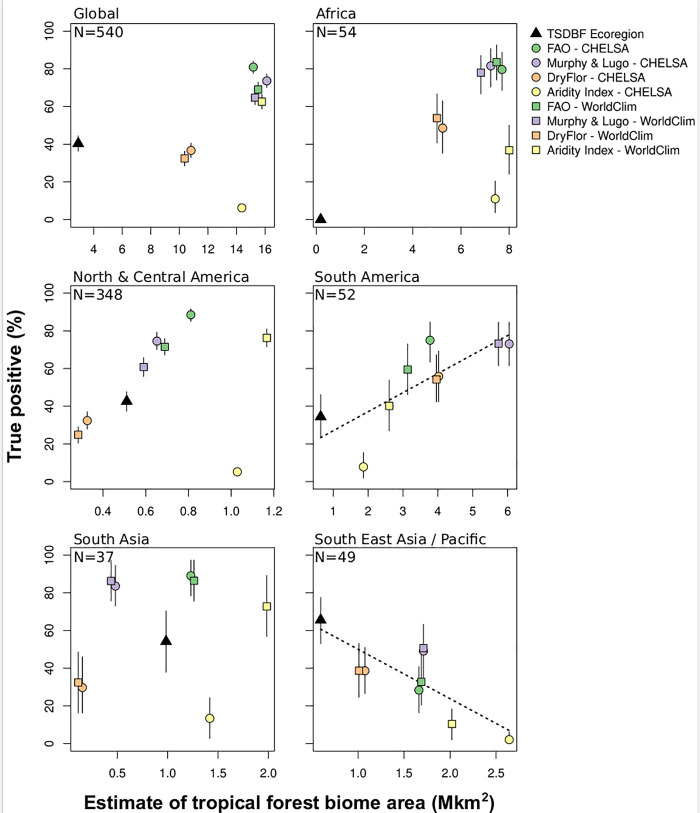
Fig 4. Estimates of the percentage of true positives and biome extent using bootstrapping with 95% confidence intervals.
Points represent the average values and segments the lower and upper bounds of the intervals (i.e. the quantiles 0.025 and 0.975, respectively) using 1,000 iterations. Dotted black lines represent significant (p < = 0.05) linear relationships between the estimate of tropical dry forest biome area and the percentage of true positive.

