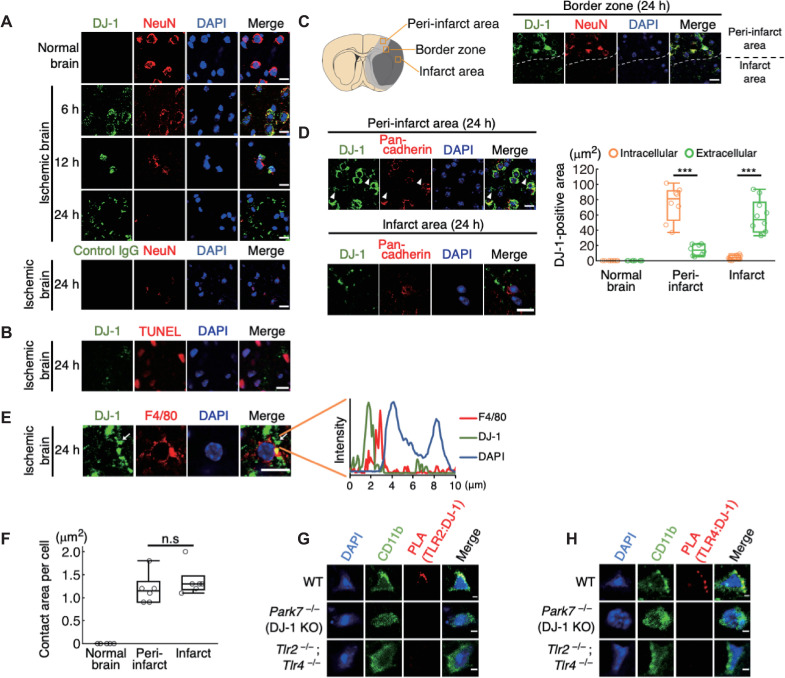
Fig 4. DJ-1 is extracellularly released from necrotic neurons and contacts infiltrating myeloid cells in the ischemic brain.
(A) Time-dependent changes of immunohistochemistry in the brain tissue before and after ischemic stroke. Control IgG was used as a control. (B) Immunohistochemical staining of DJ-1 around the TUNEL-positive dead brain cells. (C) Left panel: schematic diagram of the peri-infarct area (light gray region) and infarct area (dark gray region). The squares indicate the location where each image shown in Fig 4C or Fig 4D was captured. Right panel: immunohistochemistry in the border zone between peri-infarct area and infarct area 24 h after stroke onset. The dashed white line indicates the infarct border. (D) Immunohistochemistry in the peri-infarct area and infarct area 24 h after stroke onset (left panel). Arrowhead indicates the extracellular DJ-1-including debris. Right panel: quantification of intracellular or extracellular DJ-1-positive areas in the indicated region (n = 10 mice for normal brain and infarct area, n = 8 mice for peri-infarct area) ***p < 0.001 vs. intracellular DJ-1-positive area (E) Immunohistochemistry in the infarct region 24 h after stroke onset. The white arrow indicates the direct contact of DJ-1-including debris with the cellular membranes of infiltrating myeloid cells. Fluorescence intensity along the white arrow is shown in the right panel. (F) Quantification of areas where DJ-1-including debris contacted the cellular membranes in each infiltrating myeloid cells (n = 6 mice for each group). n.s., not significant vs. peri-infarct area. (G, H) The image of the PLA to detect the protein–protein interaction between DJ-1 and TLR2 (G) or TLR4 (H) in the infarct area of each mouse 24 h after stroke onset. All images were captured by confocal laser microscopy (one-way ANOVA with Dunnett correction [D, F]). (scale bars: 10 μm [A–E], 2 μm [G, H]). The data underlying this figure can be found in S1 Data. ANOVA, analysis of variance; IgG, immunoglobulin G; PLA, proximity ligation assay; TUNEL, terminal deoxynucleotidyl transferase–mediated dUTP-biotin in situ nick end labeling.

