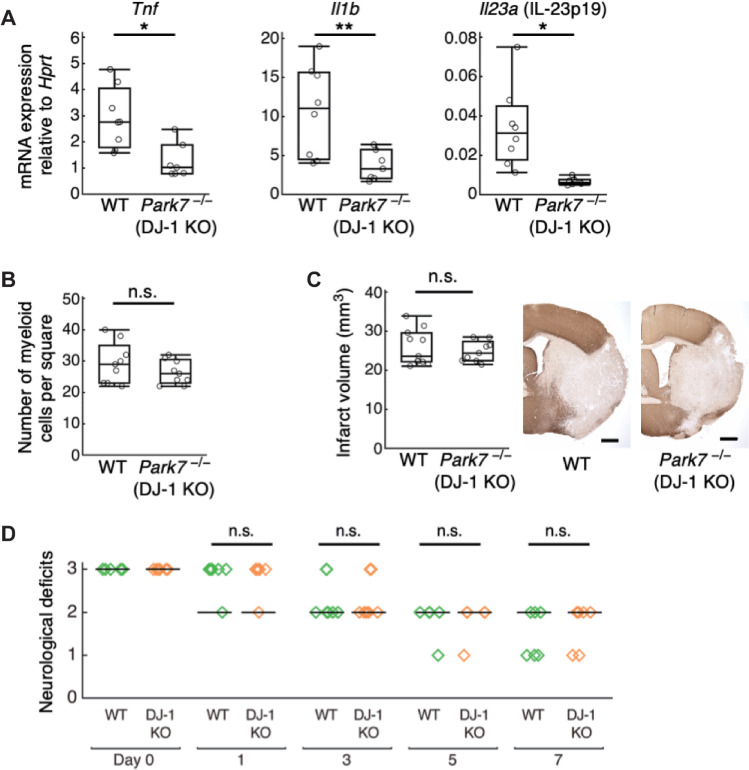
Fig 5. DJ-1 deficiency decreased the inflammatory cytokine expression but not attenuated ischemic brain injury.
(A) The mRNA expression levels of inflammatory cytokines in infiltrating immune cell–enriched cellular population collected from day 1 post-ischemic brains of WT or DJ-1 KO mice (n = 8 mice for WT, n = 7 mice for DJ-1 KO). The relative values compared to Hprt are shown. *p < 0.05, **p < 0.01 vs. WT mice. (B) The number of infiltrating CD11b+ myeloid cells detected by immunohistochemistry in the infarct area 24 h after stroke onset (n = 9 mice for each group, per 0.16 mm2). (C) Infarct volume of WT or DJ-1-deficient mice on day 7 after stroke onset (n = 12 mice for WT, n = 9 mice for DJ-1 KO) n.s., not significant vs. WT. (D) Neurological deficits of WT or DJ-1-deficient mice until day 7 after stroke onset (n = 6 mice for WT, n = 6 mice for DJ-1 KO). (Two-sided Student t test [A–C], Wilcoxon rank sum test with Bonferroni correction [D]). The data underlying this figure can be found in S1 Data. KO, knockout; WT, wild-type.

