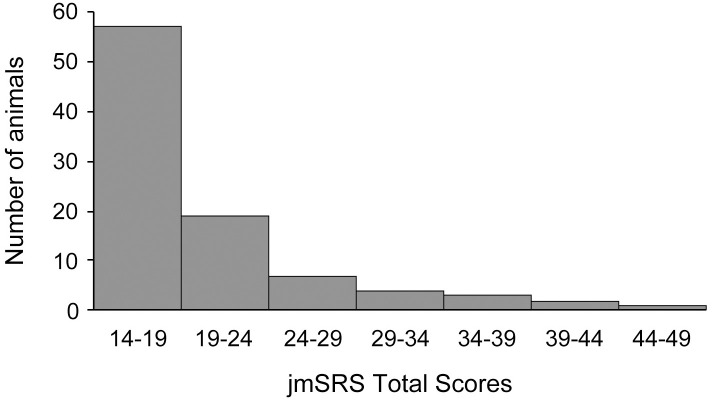
Fig 1. Histogram showing data frequency distribution of the jmSRS total scores in our juvenile macaque population.
The jmSRS total score was calculated for each subject as the sum of scores for each jmSRS item. Each column represents the number of animals with the jmSRS total score indicated on the X-axis.

