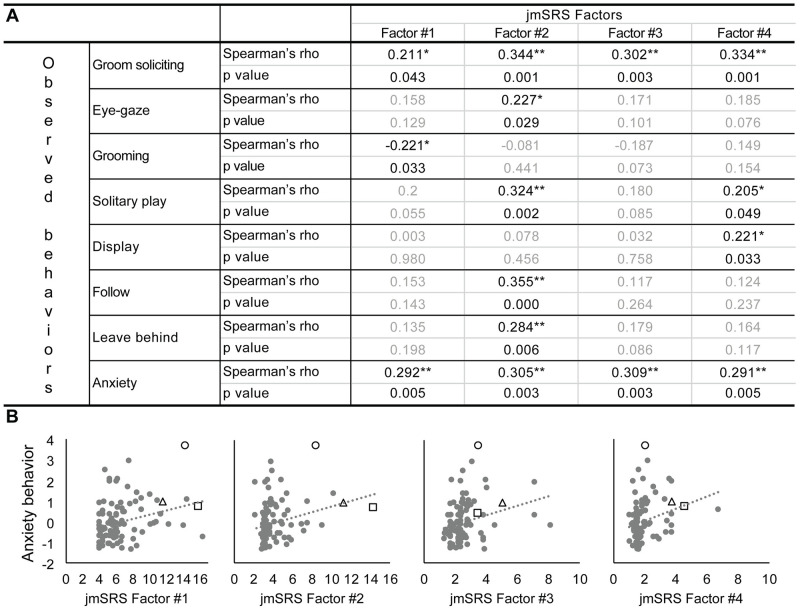
Fig 3. Correlations between the jmSRS factors (#1, #2, #3, #4) and behavior frequencies and durations collected with the ethogram.
A) Correlation matrix, showing significant Spearman rho correlation coefficients between Ethogram behaviors and the jmSRS Factors. *p<0.05, ** p<0.01. B) Examples of regression plots representing individual Anxiety and jmSRS Factors score data. Y-axis represents Anxiety Z-scored frequency rates (counts/hour; Anxiety frequency is calculated as a composite score -sum- of frequencies of scratching, yawning, body-shaking and self-directed behaviors such as self-grooming); X-axis represents the jmSRS factor scores (Factors #1–4) for each individual. The triangle, square and circle symbols represent the same 3 subjects in each graph, marked as outliers in the jmSRS and/or the anxiety behavioral scores.

