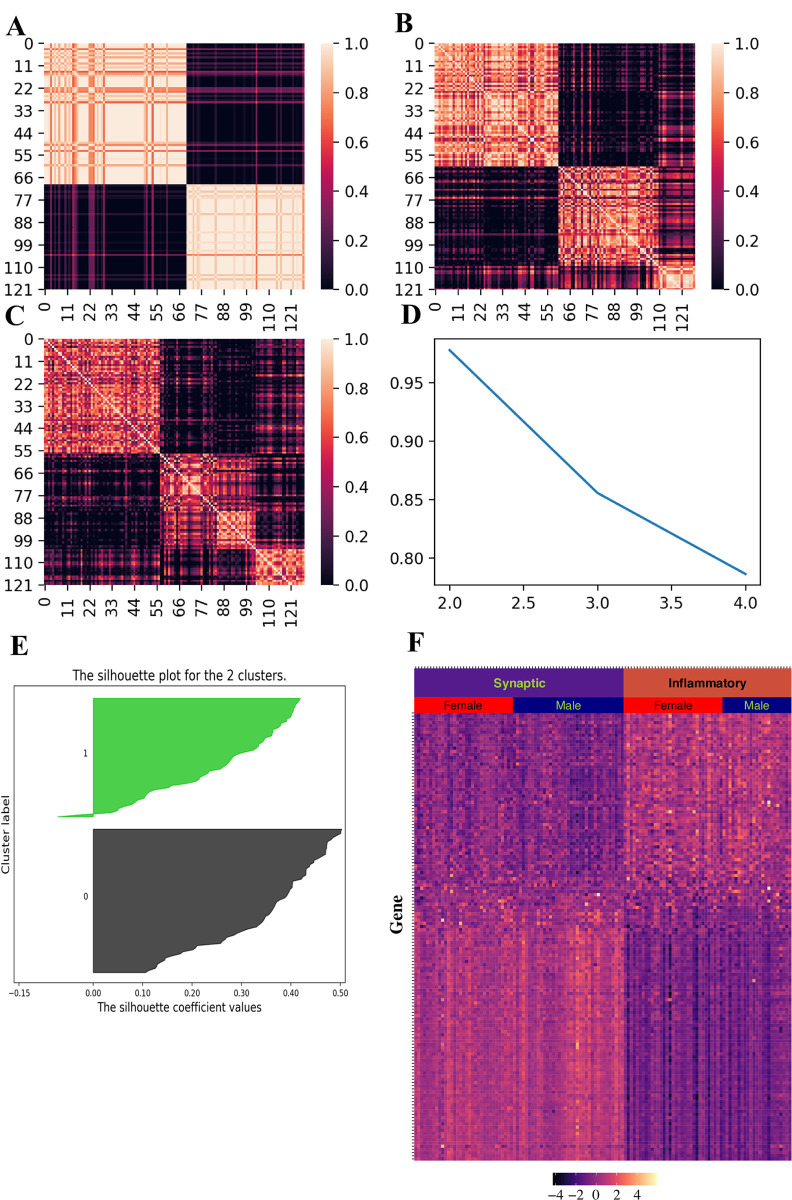
Fig 5. Molecular subtype validation in GEO dataset (GSE44770).
(A-C) Consensus matrices for 2, 3 and 4 clusters respectively. (D) Plot of cophenetic correlation coefficient against the number of clusters. (E) Silhouette distance for each sample. (F) Heatmap for signature gene expression.

