Figure 3.

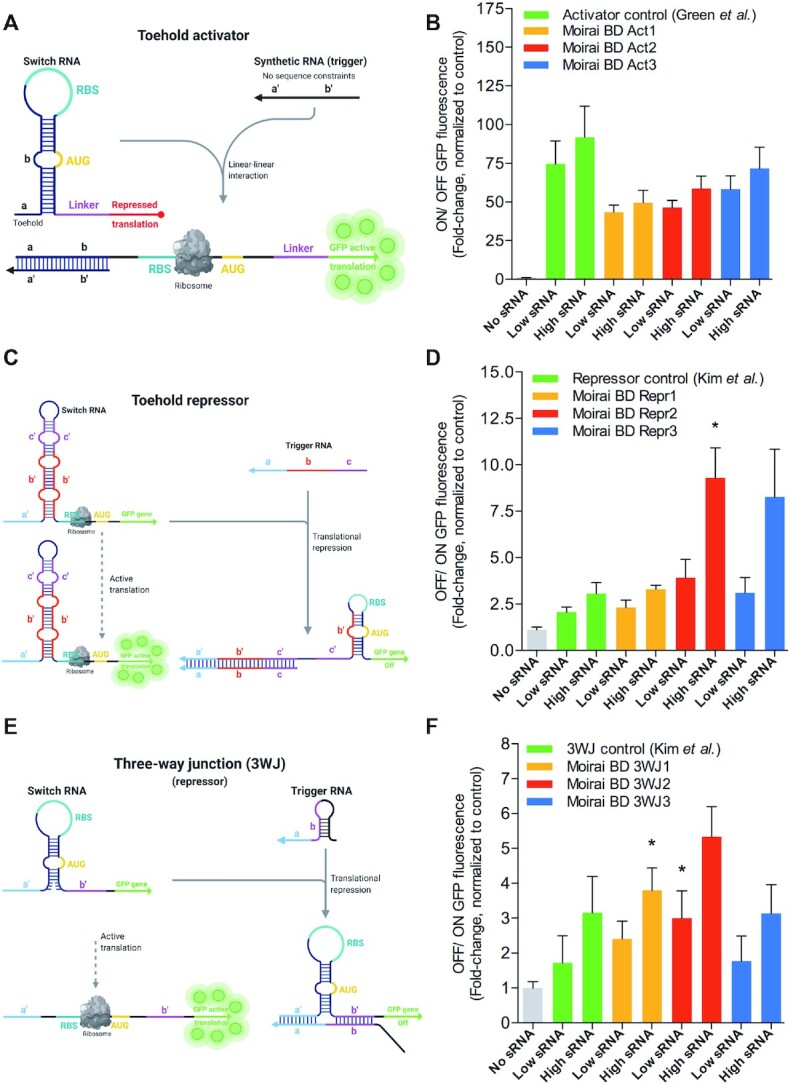
De novo MoiRNAiFold-generated toehold activators and repressor switches perform optimally in vitro. (A) Schematic mechanism of toehold switches regulating activation of translation of GFPmut3b-ASV (GFP) as described in Green et al. (29). (B) In vitro cell-free assay comparison of ON/OFF GFP fluorescence ratio toehold activator Control (Green et al. (29)) compared to three MoiRNAiFold-generated riboregulators (Moirai BD Act1–3, orange, red and blue, respectively) at low (8 μM) and high (16 μM) concentrations of synthetic RNA target (sRNA). Results represent the average (AVG) ± standard error of the mean (SEM) of at least five experiments. A Student t-test analysis shows no significant difference between sRNA treated positive control samples and sRNA treated Moirai BD Act1–3. (C) Schematic mechanism of toehold switches regulating repression of translation of GFP as described in Kim et al. (30). (D) In vitro cell-free assay comparison of GFP translation fold-change ratio (OFF/ ON) in classic repressor control (Kim et al. (24)) compared to three MoiRNAiFold-generated toeholds (Moirai BD Repr1–3, orange, red and blue, respectively) at low and high concentrations of sRNA. Results represent the AVG ± SEM of at least five experiments. A Student t-test analysis shows a significant difference between sRNA treated control and high concentration sRNA treated Moirai BD Repr2 (*P < 0.05). No other significant differences were found. (E) Schematic mechanism of 3WJ RNAs regulating repression of translation of GFP as described in Kim et al. (30); (F) In vitro cell-free assay comparison of GFP translation fold-change ratio (OFF/ ON) in 3WJ control from Kim et al. (24) compared to three MoiRNAiFold-generated 3WJ (Moirai BD 3WJ 1–3, orange, red and blue, respectively) at low and high sRNA. Results represent the AVG ± SEM of at least five experiments. A Student's t-test analysis shows significant differences between sRNA treated control and sRNA treated Moirai BD 3WJ1 and 3WJ2 for high and low sRNA, respectively (*P < 0.05). Raw data, average and deviation plus statistical analysis for panels B, D and F are shown in Supplementary Data 5.
