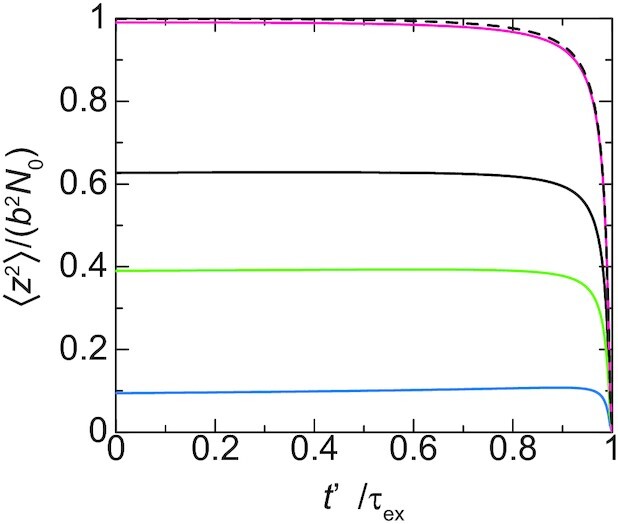
Figure 7.

The mean square distance between the promoter and the surface is shown as a function of time t′/τex elapsed since the loop extrusion process starts at  (cyan), 0.5 (light green), 1.0 (black) and 5.0 (magenta). We used
  . The black broken curve is calculated for an asymptotic limit, t0 → ∞.
