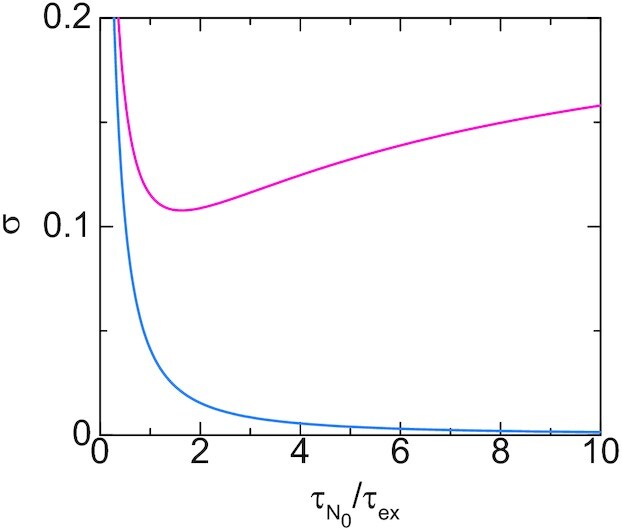
Figure 8.

The contact probability of a promoter to the surface of the transcriptional condensate is shown as a function of the ratio  of time scales for cases in which the loop extrusion is active (magenta) and not active (cyan). We used αelo = 0.3 and ρ/Kelo = 2.2 for the calculations. For the magenta line we set
  , 2kBTτm/(ζ0a2) = 5.0 (the cyan line corresponds to
  ). The ratio
  scales linear to the number N0 of units in the linker chromatin, whereas the time scale
  does not depend on the number N0 of units.
