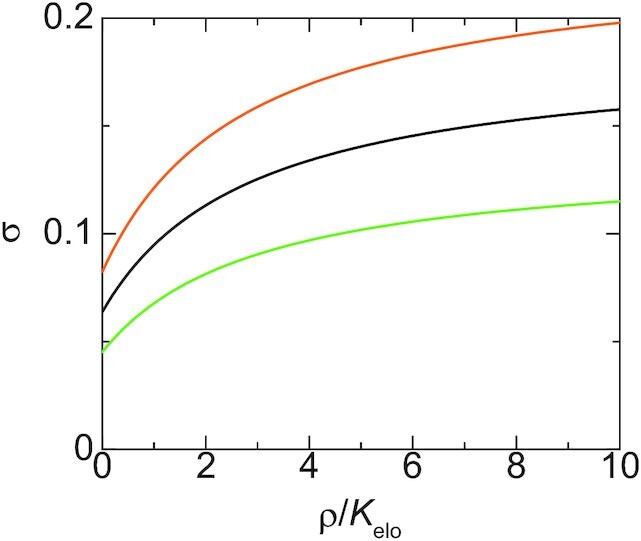
Figure 9.

The contact probability of a promoter to the surface of the transcriptional condensate is shown as a function of the concentration ρ of Pol II in the condensate for  (light green), 10.0 (black), 20.0 (orange). We used αelo = 0.3,
  , 2kBTτm/(ζ0a2) = 5.0 for the calculations.
