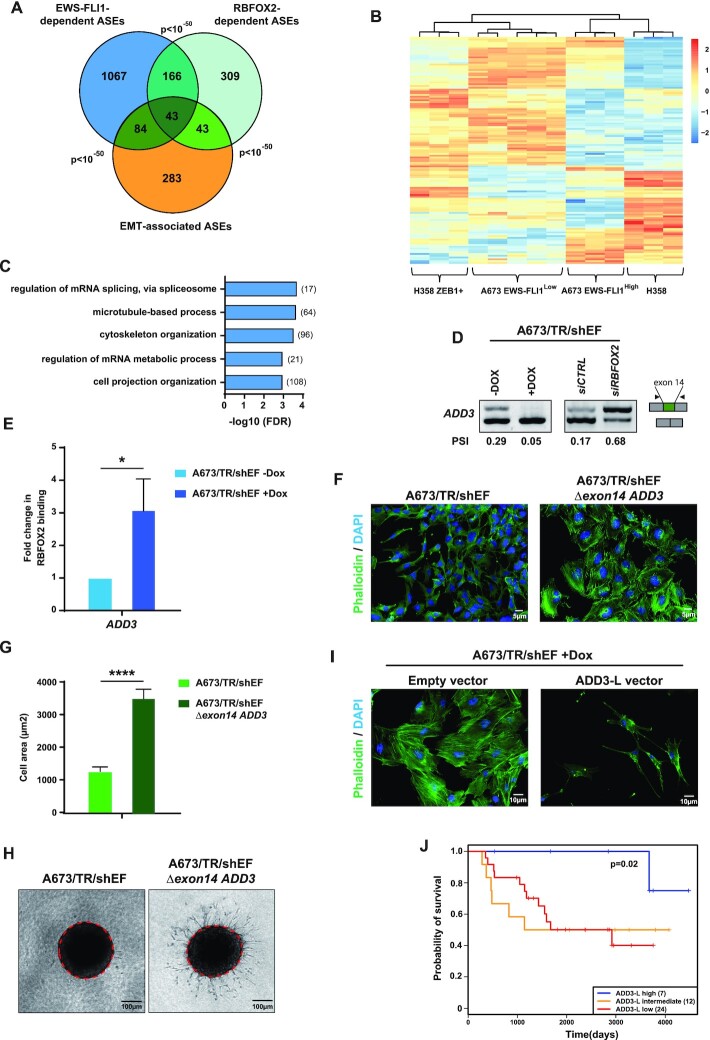
Figure 7.
ADD3 pre-mRNA splicing induced by EWS-FLI1 participates in Ewing sarcoma phenotype. (A) Overlap between EWS-FLI1- or RBFOX2-dependent exons in A673/TR/shEF cells and EMT-associated splicing events in H358 human epithelial cells. All pair-wise comparisons are highly significant (P-value < 10–50). (B) Heatmap of Z-scores of percent of spliced-in (PSI) values from significantly differentially spliced exons in EWS-FLI1high (A673/TR/shEF cells without Dox treatment) versus EWS-FLI1low (A673/TR/shEF cells at day 7 of Dox treatment) and in epithelial versus mesenchymal-like ZEB1-expressing H358 cells. (C) Distribution of top significant GO biological process terms from genes containing EWS-FLI1 and RBFOX2-regulated exons. Number of spliced genes regulated by EWS-FLI1 and RBFOX2 in each GO are indicated in brackets. (D) RT- PCR analysis of ADD3 exon 14 splicing. Samples are RNA from A673/TR/shEF cells expressing (-DOX) or not (+DOX) EWS-FLI1 (left) and RNA from A673/TR/shEF cells expressing EWS-FLI1 and transfected with control siRNA (siCTRL) or a specific RBFOX2 siRNA (siRBFOX2). (E) RNA-immunoprecipitation experiments using anti-RBFOX2 antibodies followed by RT-qPCR to detect ADD3 transcripts. Samples are RNA from A673/TR/shEF cells expressing (–DOX) or not (+DOX) EWS-FLI1. Results shown are means ± s.e.m. (n = 3 independent experiments) relative to the –DOX condition. *P < 0.05 by two-tailed unpaired Student's t-test. (F) Immunofluorescence of actin filaments stained with phalloidin (green channel) and DAPI (blue channel) of A673/TR/shEF cells and cells deleted for ADD3 exon 14 genomic region (A673/TR/shEF Δexon14 ADD3). (G) Measurement of cell area of A673/TR/shEF cells and cells deleted for ADD3 exon 14 genomic region (A673/TR/shEF Δexon14 ADD3). Data are represented as mean ± s.e.m. (n > 100 cells). ****P < 0.0001. (H) Three-dimensional type-I collagen multicellular spheroid invasion assay of A673/TR/shEF cells and cells deleted for ADD3 exon 14 genomic region (A673/TR/shEF Δexon14 ADD3). Red dotted lines represent the initial spheroid area. (I) Immunofluorescence of actin filaments stained with phalloidin (green channel) and DAPI (blue channel) of A673/TR/shEF cells treated with DOX for 7 days (EWS-FLI1low expressing cells) and transfected with either empty vector or vector expressing the ADD3-L isoform. (J) Kaplan-Meier curve of ADD3 exon 14 PSI values in 43 Ewing tumors showing significant differences between tumors expressing high and low levels of ADD3-L isoform. Tumors were separated by k-means clustering. Number of tumors in each subgroup is indicated in brackets.

