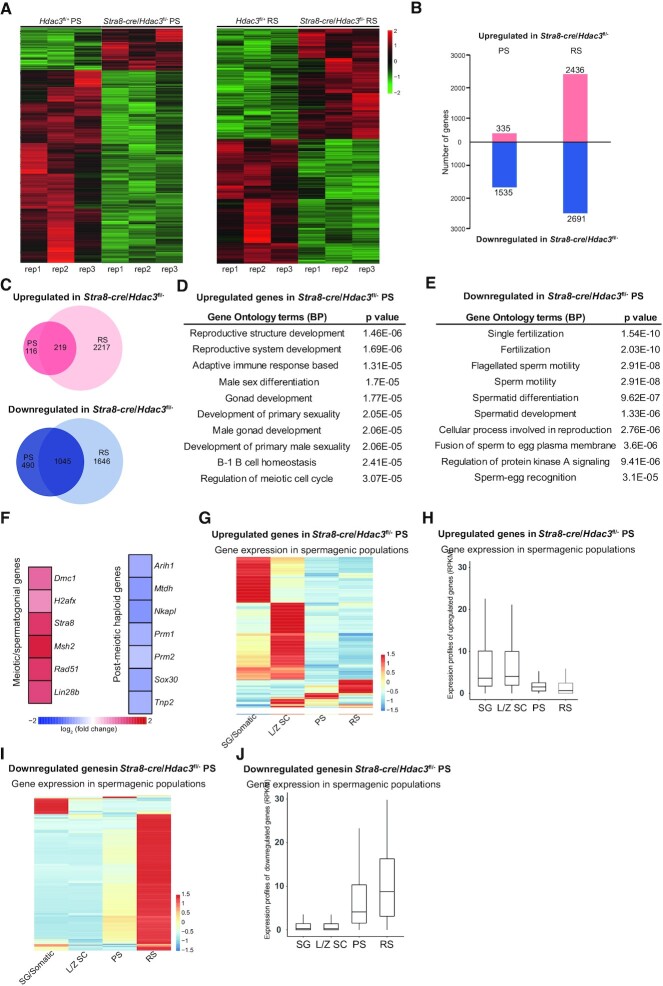
Figure 3.
HDAC3 regulates transcriptomic programming during the meiotic-to-postmeiotic transition in the male germline. (A) Heatmap of RNA-seq data showing differentially expressed genes (DEGs) in PS (left) and RS (right) from wild-type and Stra8-cre/Hdac3fl/– testes. PS and RS were isolated from adult Hdac3fl/+ (n = 6) and Stra8-cre/Hdac3fl/– (n = 10) for each set. Experiments were performed in biological triplicates. (B) The number of DEGs (P < 0.01, fold change > 1.5). (C) Venn diagram showing the overlap among the upregulated transcripts (up) and down-regulated transcripts (bottom) in Stra8-cre/Hdac3fl/– cells compared to WT at both PS and RS stages. (D, E) The top 10 most enriched GO biological processes based on their P-values for upregulated genes and downregulated genes in Stra8-cre/Hdac3fl/– PS were shown. (F) Heat map depicting upregulated genes and downregulated genes identified in Gene Ontology analysis. (G, I) Upregulated genes or downregulated genes in Stra8-cre/Hdac3fl/– PS were used to produce a heatmap depicting their expression profile in stage-specific spermatogenic cells. SG/Somatic: spermatogonial and somatic cells, LZ-SC: leptotene/zygotene spermatocytes. (H, J) Average expression levels of upregulated genes or downregulated genes in Stra8-cre/Hdac3fl/– PS across stage-specific spermatogenic cells.

