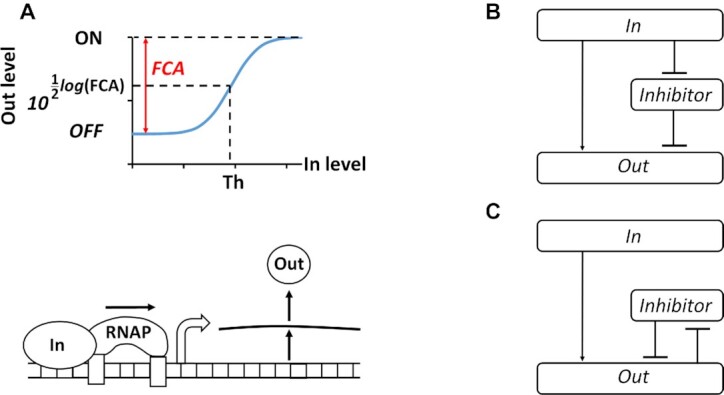
Figure 1.

Fold change activation (FCA) and block diagrams for ICF and DNF designs. (A) Describes the transfer function of promoter activity (Supplementary Figure S1A). FCA is the ratio between ON and OFF states of the promoter. The OFF state is the minimum activity of the promoter and is achieved when no input molecules are present and there is only leaky gene expression (basal level) due to the unspecific binding of RNA polymerases (RNAPs). The ON state is the maximum activity of the promoter. ‘Th’ is the input threshold of genetic switches and equals to half of FCA on the logarithmic scale. (B) Schematic diagram of the indirect coherent feedforward (ICF) circuit. Input molecules regulate both the inhibitor and the output level. (C) Schematic diagram of the mutual inhibition through double negative feedback (DNF) circuit. A positive feedback between the inhibitor and the output is coupled through mutual repression.
