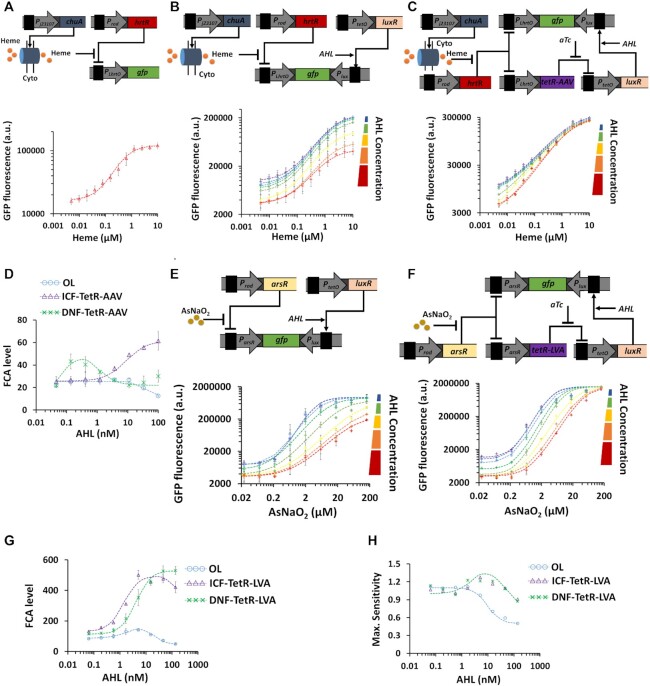
Figure 7.
ICF and DNF topologies for specific bacterial biosensors sensitive to heme and arsenic (AsNaO2) based on antisense transcription. (A) Blood sensor operation. Experimentally measured heme-GFP transfer function of a blood sensing circuit in the simplest (wild-type) design. Transporter proteins are constitutively expressed from ChuA gene. HrtR is a repressor and is driven by a constitutive promoter. A heme-group containing molecule enters the bacterial cells through the outer membrane ChuA protein and binds the transcriptional repressor HrtR to form a heme-HrtR complex which is then released from PLhrtO heme-inducible promoter allowing its activation and GFP expression. (B) Experimentally measured heme-GFP transfer function of PLhrtO-based OL circuit relative to AHL concentration. (C) The measured heme-GFP transfer function of PLhrtO based ICF circuit (TetR is fused with a AAV degradation tag) relative to AHL concentration. (D) FCA levels derived from experimental results for various blood sensor circuits (OL, ICF, DNF) as a function of AHL concentration. (E) Arsenic sensor circuit with inducible antisense transcription. The transcription factor ArsR encoded by arsR gene is constitutively expressed to repress ParsR promoter. Arsenic input, AsNaO2, can bind with ArsR to release the repression on ParsR, to produce a GFP signal. A reverse Plux is located downstream of gfp gene to induce antisense transcription. The induction of antisense transcription is controlled by varying AHL concentrations. Experimentally measured arsenic-GFP transfer function of ParsR-based OL circuit under various AHL concentrations. (F) Experimentally measured arsenic-GFP transfer function of ParsR-based ICF circuit (TetR is fused with a LVA degradation tag) under various AHL concentrations. (G) and (H) FCA levels, Maximum sensitivity derived from experimental results for various arsenic sensor circuits (OL, ICF, DNF) under various AHL concentrations. The dotted lines are fittings using Hill-functions ( ). All experimental data represent the average of three experiments. The flow cytometry data for this figure is provided in Supplementary Information, Supplementary Figures S39-S53.

