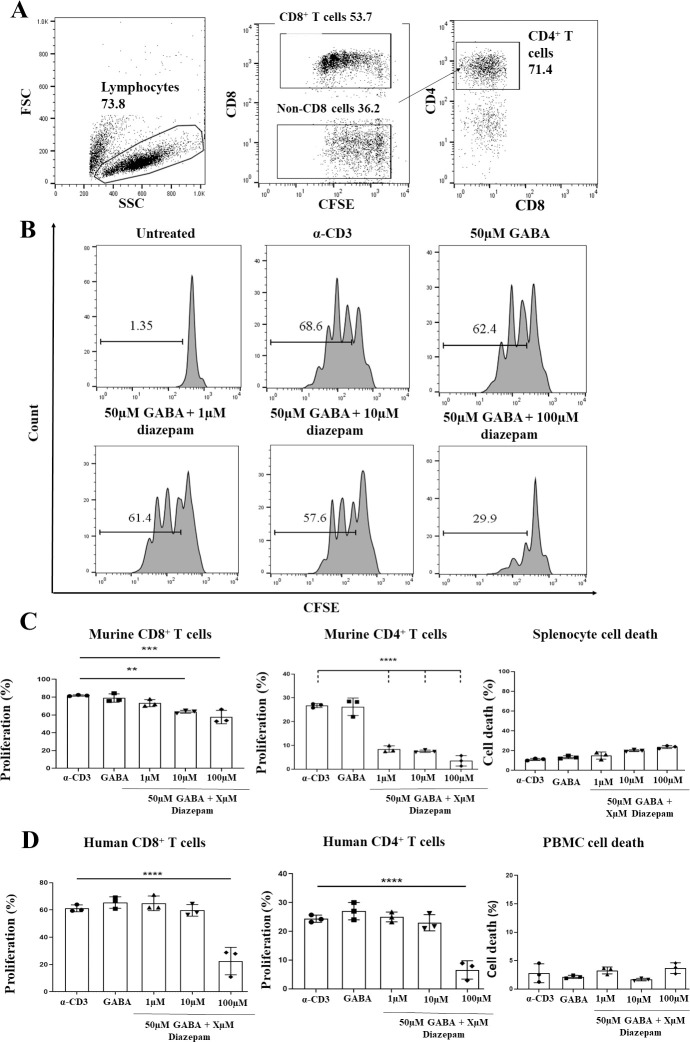
Fig 2. Diazepam can inhibit T cell proliferation in a dose dependent manner.
Splenocytes were isolated from the spleens of female wildtype BALB/c mice, and PBMC were isolated from human whole blood samples. Cells were stained with 5 μM CFSE, before being treated with soluble α-CD3 antibody (33 ng/ml for splenocytes, 100 pg/ml for PBMCs), in addition to 50 μM GABA alone, or 50 μM GABA plus 1 μM, 10 μM or 100 μM diazepam. Splenocytes were harvested following 48 hours of treatment, while PBMC were harvested following 96 hours of treatment. The percentage of proliferating T cells in each condition was determined by flow cytometry through assessing the reduction in CFSE fluorescence. A. Representative flow cytometry plots depicting the gating strategy used to identify cell populations of interest from PBMC and splenocyte preparations. Lymphocytes were gated according to size (forward scatter; FSC) and granularity (side scatter; SSC). Within the lymphocyte gate, CD8+ and CD4+ T cells were further gated using established lineage markers for these cells (CD8 and CD4). Histograms were used to determine the percentage of proliferating cells present under each condition, compared to an untreated control. B. Exemplar flow cytometry plots (from human CD8+ T cells) depicting the dose dependent inhibition of α-CD3 stimulated proliferation caused by treatment of cells with 50 μM GABA and varying concentrations of diazepam. C. Dose dependent inhibition of α-CD3 stimulated proliferation in CD8+ and CD4+ T cells following treatment of splenocytes with 50 μM GABA and varying concentrations of diazepam. In addition, splenocyte death in response to diazepam treatment is shown. D. Dose dependent inhibition of α-CD3 stimulated proliferation in CD8+ and CD4+ T cell following treatment of PBMC with 50 μM GABA and varying concentrations of diazepam In addition, PBMC death in response to diazepam treatment is shown. Data shown are from 3 independent experiments, with error bars (SD). Differences between groups were assessed by one-way ANOVA. * = p<0.05. ** = p<0.01. *** = p<0.001. **** = p<0.0001.

