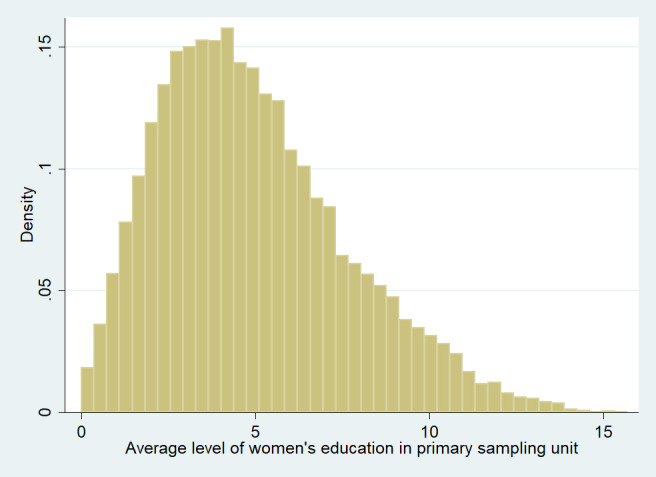
Fig 1. Frequency distribution of primary sampling units by average level of women (above 19 years of age)’s education in completed years of schooling.

(n = 23499) (Graph prepared using Stata 12 [54]).

(n = 23499) (Graph prepared using Stata 12 [54]).