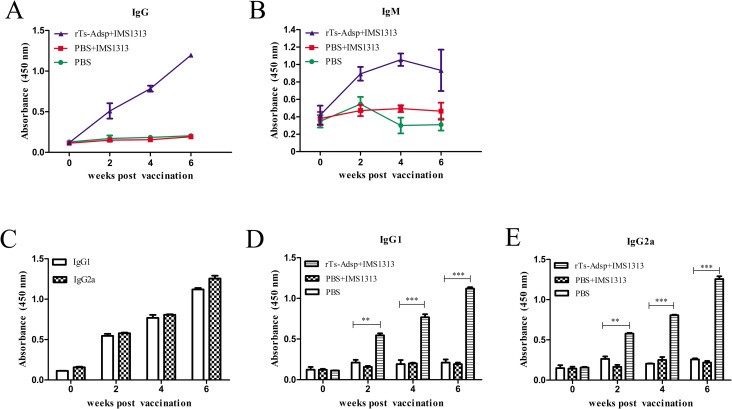
Fig 2. Immune responses from the vaccinated pigs.
(A) The levels of IgG against rTs-Adsp were measured by ELISA. (B) The levels of IgM in the sera of immunized pigs were measured by ELISA. (C) IgG subclass responses to the rTs-Adsp were measured by ELISA. (D) The IgG1 subclass responses against rTs-Adsp were evaluated at different time points. (E) The IgG2a subclass responses against rTs-Adsp were evaluated at different time points. The values shown for each group are the mean ± SD of the antibody levels. Significant differences were as follows: *p< 0.05; **p< 0.01; ***p< 0.001.

