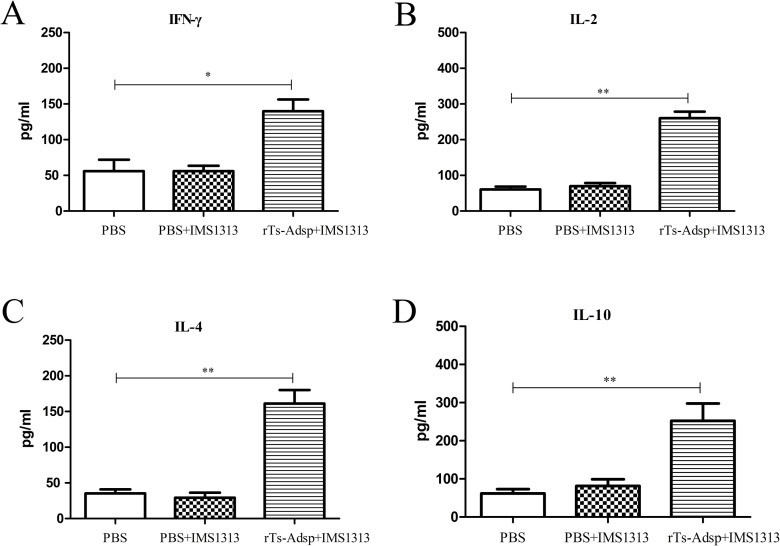
Fig 3. Cytokine production from sera were evaluated by ELISA.
The levels of (A) IFN-γ (B) IL-2 (C) IL-4 (D) IL-10 are presented as the mean ± SD (n = 6). Asterisks indicate that the production of cytokines from immunized group are significantly different from (*p<0.05, **p<0.01, ***p< 0.001) that of PBS control group.

