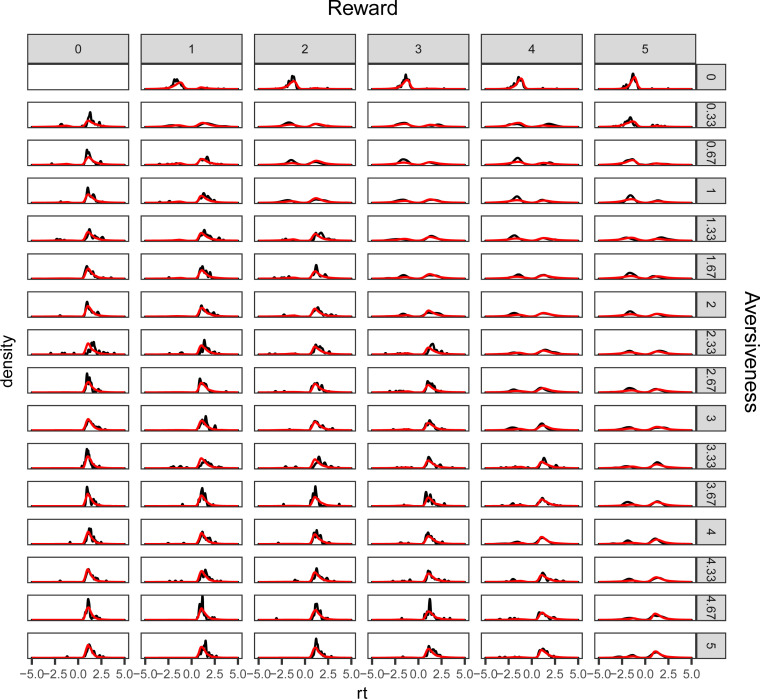
Fig 2. Posterior predictive check.
The figure illustrates the models’ (red lines) ability to recreate observed (black lines) choice and response time distributions across all combinations of offered reward and aversiveness. Avoidance decisions are set to have negative response times to distinguish the reaction time distribution of decisions to approach and avoid offers and to indicate the relative proportion of (observed and predicted) approach and avoidance decisions across combinations of reward and aversiveness.

