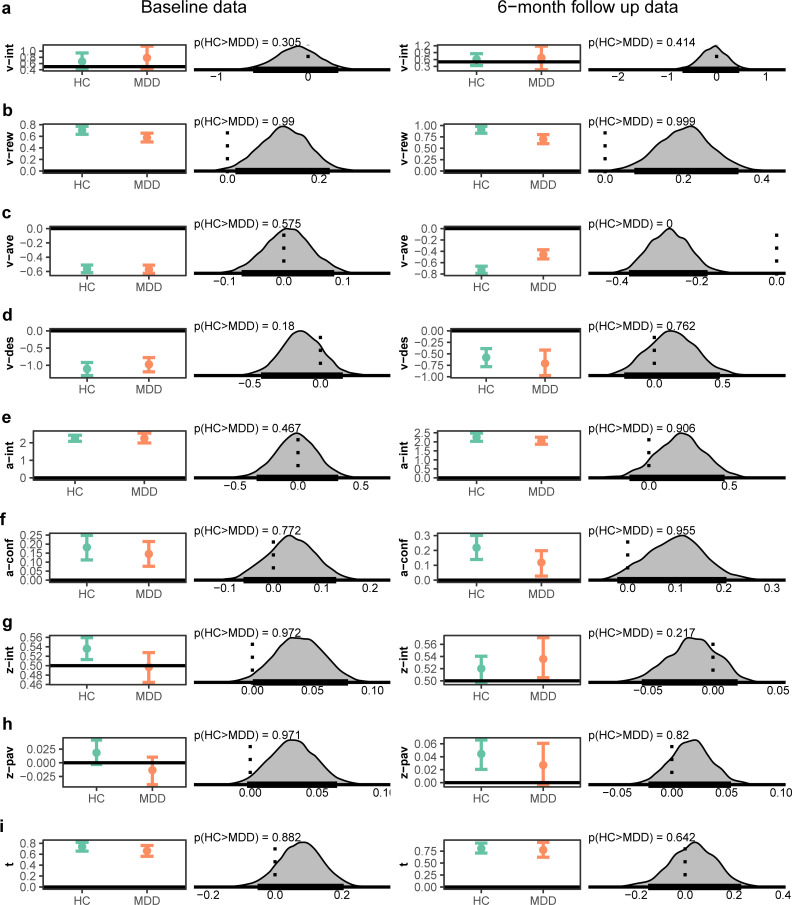
Fig 5. Posterior distributions across MDD and HC at the original data collection and for the same task applied to a subset of participants at 6-month follow-up.
For each coefficient the left plot shows the group posterior distribution for healthy controls (HC) and individuals with major depressive disorder (MDD). The right plot shows the posterior distribution of difference as a measure of the effect of group on each coefficient, and the probability given data that the coefficient is higher in HC than MDD. a, Intercept drift rate (v), b, weight of reward onto drift rate (v), c, weight of aversiveness onto drift rate (v), d, dummy coding of reward onto drift rate (v) (1 = reward offer of 0, 0 = non-zero reward offer), e, Intercept value decision threshold (a), f, influence of conflict on decision threshold (a) g, estimated relative starting point (z) between decision thresholds, h, impact of Pavlovian effect onto starting point (z) and i, non-decision time (t), For statistics from posterior distributions in follow-up data see Table B in S1 Text. HC = healthy controls, MDD = Major Depressive Disorder.

