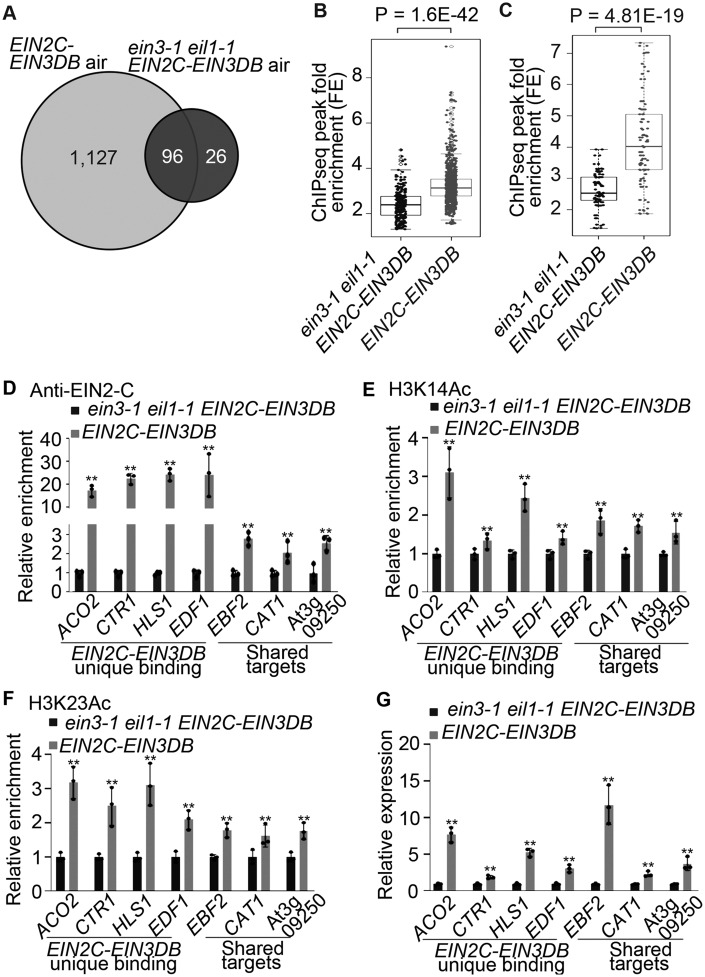
Figure 2.
Endogenous EIN3 protein regulates EIN2C–EIN3DB binding activity, histone acetylation, and gene expression. (A) Venn diagram showing EIN2C–EIN3DB-bound targets in the Col-0 and ein3-1 eil1-1 backgrounds. ChIP-seq was conducted on 3-day-old etiolated EIN2C–EIN3DB and ein3-1 eil1-1 EIN2C–EIN3DB seedlings treated with air. (B and C) Boxplots and dotplots of peak signals in EIN2C–EIN3DB and ein3-1 eil1-1 EIN2C–EIN3DB seedlings determined by analyses of (B) signals from the peaks identified in EIN2C–EIN3DB and ein3-1 eil1-1 EIN2C–EIN3DB or (C) signals from shared peaks. P-value was calculated by one-way ANOVA and indicated in the figure. (D–F) ChIP-qPCR assays of (D) the binding of EIN2C–EIN3DB, (E) H3K14Ac levels, and (F) H3K23Ac in selected loci from 3-day-old etiolated seedlings of the indicated backgrounds. Data represent relative fold changes. G, RT-qPCR quantification of gene expression in 3-day-old etiolated seedlings. Shared targets indicate binding targets that are shared between ein3-1 eil1-1 EIN2C–EIN3DB and EIN2C–EIN3DB. Each ChIP-qPCR or RT-qPCR was repeated at least three times. Values are means ± SD of three biological replicates. **P< 0.05 when compare to the control in Col-0 background by one-tailed unpaired t test.

