Figure 2.
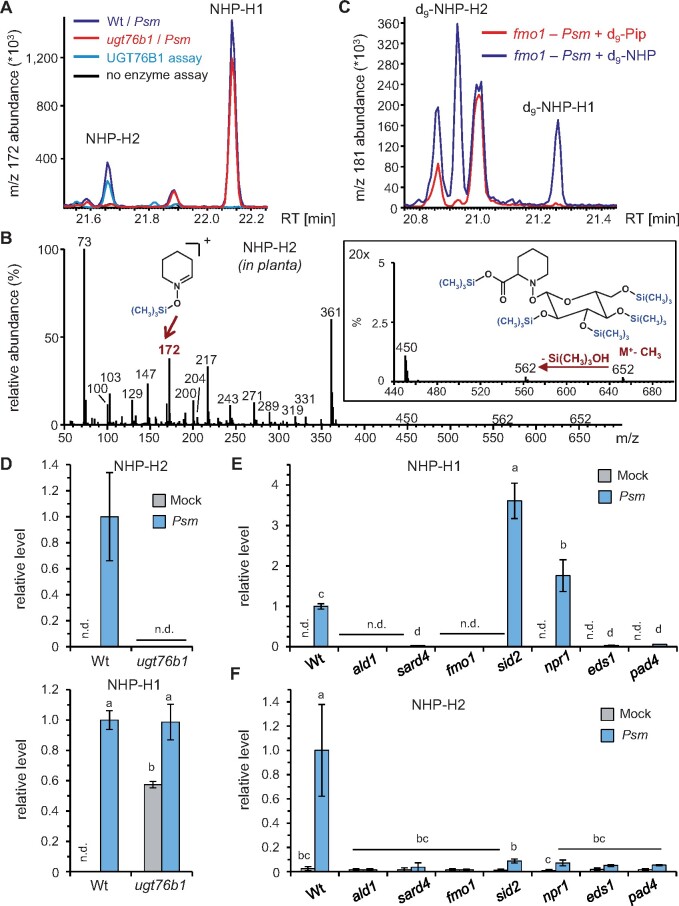
Inoculation with Psm induces accumulation of two distinct NHP-H derivatives dependent on a functional NHP biosynthetic pathway. A, GC–MS analysis reveals the accumulation of two distinct NHP-hexose conjugates (NHP-H1 and NHP-H2) in leaves of Psm-inoculated Col-0 plants. Overlaid ion chromatograms (m/z 172) are shown (blue: Wt, red: ugt76b1). NHP-H1 accumulates independently of UGT76B1 and represents the NHP-hexose-conjugate previously described by Hartmann and Zeier (2018). The accumulation of NHP-H2 is absent in ugt76b1 mutants. Moreover, NHP-H2 is synthesized in vitro by recombinant UGT76B1 (green: full enzyme assay with recombinant UGT76B1, black control assay without enzyme). Sample derivatization by trimethylsilylation was performed prior to GC–MS analyses. B, Mass spectrum of the penta-trimethylsilylated NHP-hexoside NHP-H2 (molecular weight: 667 g mol−1) from plant extracts. The M+-CH3 ion at m/z 652, which produces an m/z 562 ion by loss of Si(CH3)3OH, is clearly discernible. The structure of the trimethylsilyl-N-hydroxypiperidine fragment at m/z 172 is indicated. Fragment ions characteristic for per-trimethlysilylated hexose conjugates are m/z 450, m/z 361, m/z 271, m/z 217, and m/z 204 (Ehmann, 1974). Note that the mass spectrum of penta-trimethylsilylated NHP-H1 exhibits similar fragmentation patterns, including a more prominent m/z 172 (Hartmann and Zeier, 2018). C, Both NHP-H2 and NHP-H1 are biosynthetically derived from NHP. Feeding of deuterated D9-NHP to Psm-inoculated fmo1 plants results, in contrast to feeding with D9-Pip, in the formation of D9-labeled NHP-H2 and D9-labeled NHP-H1. Ion chromatograms of m/z 181 are depicted. The m/z 181 ion corresponds to a D9-trimethlysilyl-hydroxypiperidine fragment. GC–MS analyses as described in (A) and (B). D, Relative levels of NHP-H2 and NHP-H1 in Psm-inoculated or Mock-treated (MgCl2-infiltrated) leaves of Wt and ugt76b1 plants at 48 hpi. Data represent the mean ± sd of three biological replicates. Mean levels in Psm-inoculated Col-0 leaves are set to 1. Different letters denote significant differences (P < 0.05, ANOVA and post hoc Tukey HSD test). E and F, Relative levels of NHP-H1 (E) and NHP-H2 (F) in Psm-inoculated or Mock-treated leaves of Wt plants, NHP biosynthesis-defective mutants (ald1, sard4, and fmo1), SA pathway mutants (sid2 and npr1), as well as eds1 and pad4 mutants at 24 hpi. Other details as described in (D).

