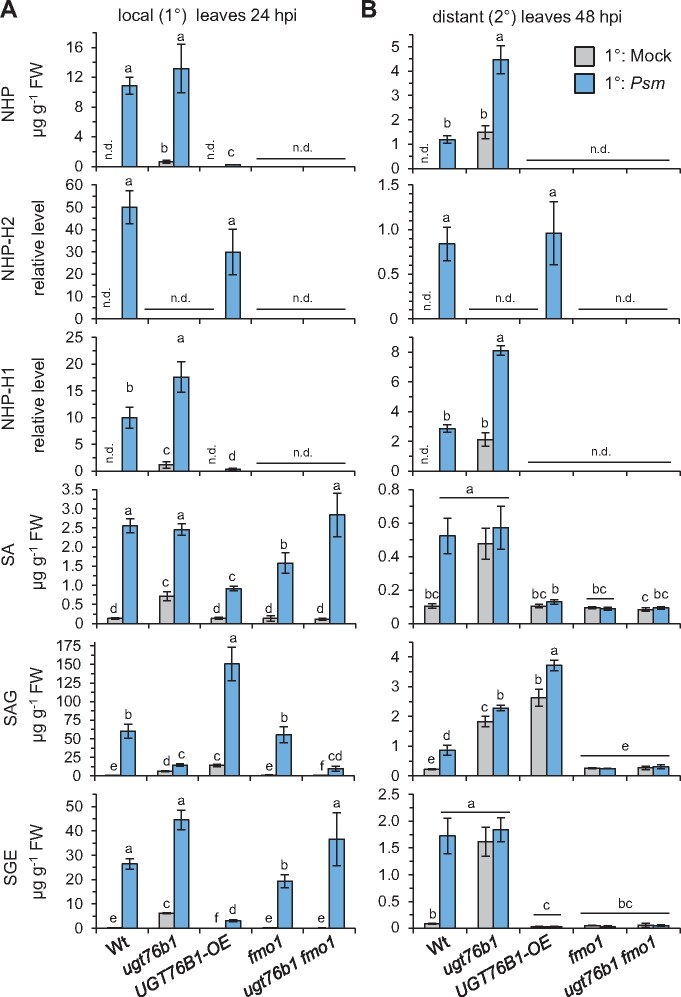
Figure 8.
The Psm-induced local and systemic accumulation of NHP, SA, and the respective glucose conjugates is deranged in ugt76b1 knockout and UGT76B1 OE lines. A, Levels of NHP, NHP-H2, NHP-H1, SA, SAG, and SGE in Psm-inoculated or Mock-treated leaves of the indicated Arabidopsis lines at 24 hpi. Bars represent means ± sd of four biological replicates Different letters denote significant differences (P < 0.05, Kruskal–Wallis H test). B, Levels of defense metabolites in 2°-distant leaves upon Psm- or Mock-inoculation of 1° leaves at 48 hpi. Details as described in (A). The accumulation of Pip in these scenarios is depicted in Supplemental Figure S12.

