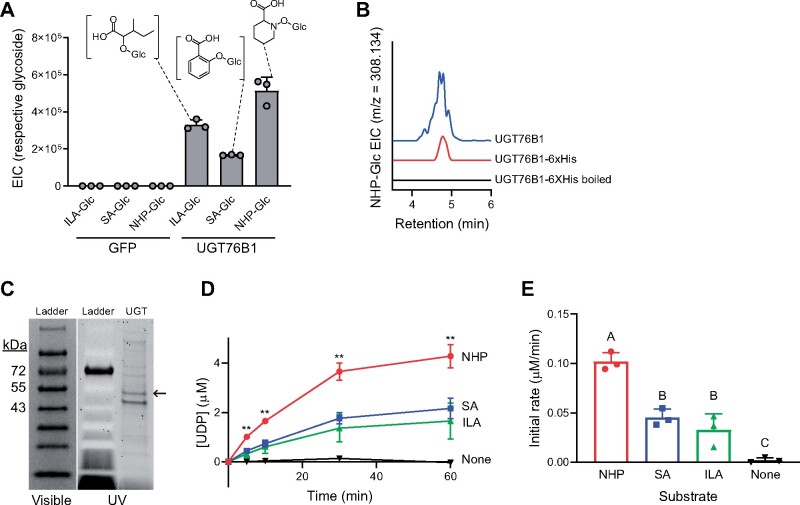
Figure 2.
In vitro characterization of Arabidopsis UGT76B1. A, GFP or Arabidopsis UGT76B1 was transiently expressed in N. benthamiana leaves and crude protein extracts were incubated with 5 mM UDP glucose and 1 mM aglycone substrates (2-hydroxy-3-methylvaleric acid [ILA], SA, or NHP). Levels indicate abundances of glycosides measured with LC–MS after 3 h incubation. Bars represent the mean ± sd (n = 3 independent biological replicates). m/z used for quantification are: ILA-Glc ([M-H]− = 293.124), SA-Glc ([M-H] − = 299.077), and NHP-Glc ([M+H]+ = 308.134). The experiment was repeated two times with similar results. B, Representative LC–MS chromatograms of NHP-Glc (m/z = 308.134) from crude extract from N. benthamiana leaves transiently expressing Arabidopsis UGT76B1 (blue) and enriched (red) or denatured (black) UGT76B1-6xHis purified from N. benthamiana leaves. C, SDS–PAGE gel of enriched UGT76B1-6xHis purified from E. coli. The same gel imaged under visible light and UV light is included to better visualize the ladder bands. Expected mass of UGT76B1-6xHis is ∼51 kDa. D, Enriched UGT76B1-6xHis from E. coli was incubated with NHP (red), SA (blue), ILA (green), or no substrate (black) in vitro. Aliquots were quenched at increasing time points, and free UDP liberated from the reaction of UGT76B1 with its respective substrates was measured using an enzyme-linked assay. Asterisks indicate a significant difference (two-tailed t test; **P < 0.01). Points represent the mean ± sd (n = 3 independent biological replicates). The experiment was repeated two times with similar results. E, Initial rate of reaction from (D) was measured as the slope from t = 0 to t = 5 min. Different letters indicate significantly different groups using two-tailed t tests (P < 0.01). Bars represent the mean ± sd (n = 3 independent biological replicates).

