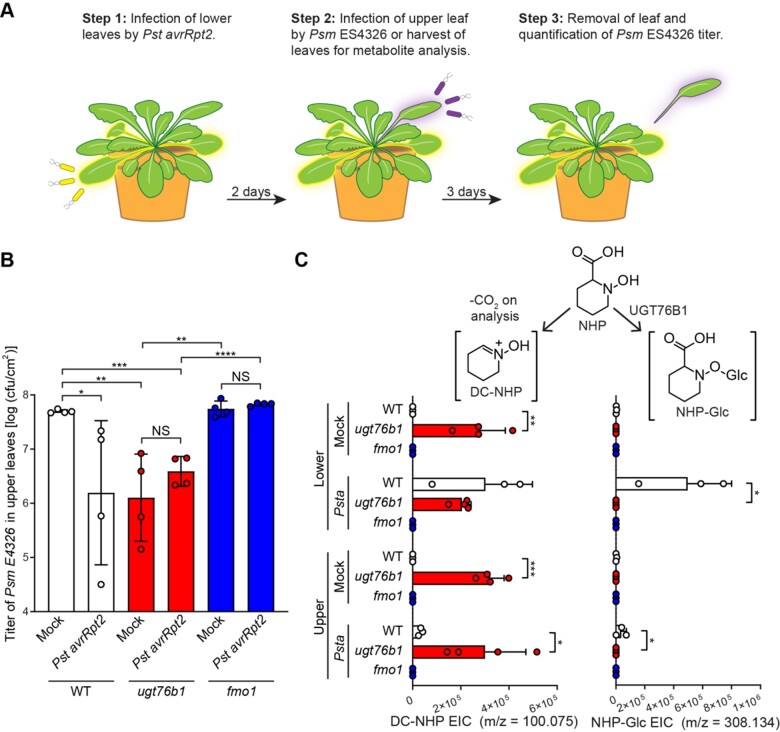
Figure 4.
SAR assays in Arabidopsis WT, ugt76b1, and fmo1 plants. A, Design of SAR assays in Arabidopsis. Three lower leaves (leaf numbers 5–7) of each plant were infiltrated with a 5 × 10⁶ cfu/mL suspension of Pst avrRpt2 (Psta; local infection) or 10 mM MgCl2 as a mock control. For the bacterial growth assays in (B): 2 days after local infection, one upper leaf (leaf number 10) of each plant was challenged with 1 × 10⁵ cfu/mL suspension of Psm ES4326 (distal infection). Three days later, the disease symptoms of upper leaves were photographed and the titer of Psm ES4326 was determined. For metabolite analysis in (C): 2 days after local infection with Pst avrRpt2, the three lower infected leaves and three upper uninfected leaves (leaf numbers 8–10) were harvested and separately pooled for metabolite analysis. B, Titer of Psm ES4326 in upper, challenged leaves of WT (white bars), ugt76b1 (red bars), and fmo1 (blue bars) plants. Bars represent the mean ± sd (n = 4 independent biological replicates). Asterisks indicate a significant difference in bacterial titer (one-tailed t test; *P < 0.05, **P < 0.01, ***P < 0.001, ****P < 0.0001, NS—not significant). The experiment was repeated three times with similar results. Repetition 2 of this experiment is reported in Supplemental Figure S6. C, Extracted ion abundances of DC-NHP (a degradation product of NHP) and NHP-Glc in methanolic tissue extracts from lower and upper leaves of WT (white bars), ugt76b1 (red bars), and fmo1 (blue bars) plants. Bars represent the means ± sd (n = 3 or 4 independent biological replicates). DC-NHP and NHP-Glc were measured using LC–MS. Values reported as zero indicate no detection of metabolites. Asterisks indicate a significant difference in metabolite levels (one-tailed t test; *P < 0.05, **P < 0.01, ***P < 0.001). The experiment was repeated two times with similar results.

